RESOURCES FOR QUEENSLAND STUDENTS & TEACHERSSTUDENT EXPERIMENT IDEASIdeas for Year 11 and 12 Biology Student ExperimentsFrom Dr Richard Walding, BAppSc, MSc, MPhil, PhD, FAIP, FRACI, CChem, Griffith University, Australia
|
|---|


Many of the suggestions below involve the use of animals.
Various laws apply to the use of animals in schools particularly any "live non-human vertebrate, that is fish, amphibians, reptiles, birds and mammals, encompassing domestic animals, purpose-bred animals, livestock, wildlife, and also cephalopods such as octopus and squid".
For some further advice go to Use of Animals note at the end.
TWO MAIN APPROACHES FOR A STUDENT EXPERIMENT
In general there are two main methods used in senior high school student experiments. They are:
The method of artificial variation: where you manipulate one variable to see the effect on the other (and keeping the rest constant) For example, what is the effect of temperature (the manipulated or independent variable, IV) on the enzyme digestion of starch (the dependent variable, DV).
The method of concomitant variation: where some naturally occurring variation in some condition (Variable 1) is correlated against some other condition (Variable 2). This is also called a "correlation method". You can think that nature has manipulated the variables but it is still appropriate to class one as dependent and one as independent. For example, do young leaves have the same density and distribution of stomata as older leaves; or how does temperature (IV) in a natural environment affect stoma opening (DV)? In this second case you do not need you to control the environmental temperature, but you do need to measure the DV at different temperatures.
The difficulty with the second approach is the control of other potentially influential variables (such as humidity - as you have to take what you get). However, that does not preclude the variables in relationship being considered the IV and DV or being graphed as such. One way to address the confounding variables (eg humidity) is to collect data on the other variable as well. That is, call the stoma/temperature data Part I, and call the stoma/humidity data Part 2. You can run the statistics on each pair separately, but, for students who are not that "stats-savvy" then they could look for interactions between them at a visual level. [My thanks to Marilyn Love, Science Department, All Hallows' School, Brisbane for this example].
FOOD TECHNOLOGY OPTIONS
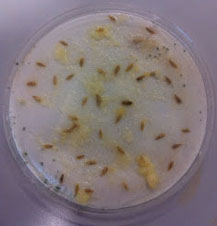
Does the amount of bacterial growth in food differ according to its preparation or handling?
Although some micro-organisms are deliberately used to make foods such as yoghurt and cheese, other microbes 'spoil' food. Food, as well as meeting the nutritional requirements of humans, will also meet the nutritional needs of a vast range of micro-organisms. These microbes will multiply rapidly in food, given the appropriate conditions such as temperature, pH and moisture.
The flavour, aroma and texture will ultimately be affected. Microbial contamination accounted for 34% of all food recalls by Food Standards Australia New Zealand (FSANZ) between 1 January 1990 and 31 December 2004. Of these recalls, 41% were due to Listeria monocytogenes contamination; 19% were due to Salmonella contamination and 13% were from Escherichia coli contamination (Food Standards 2010). Those most affected by food poisoning are the elderly, the young and immune suppressed individuals. This student experiment is suggested by Biology teacher Sylvia Hicks from St Aidan's College, Corinda.
 |
 |
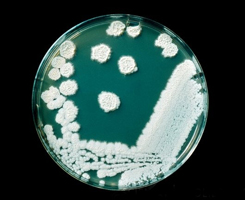
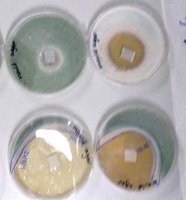
| A petri dish culture of the yeastlike organism (fungus) Candida krusei, after 10 days growth on dextrose agar. This species is known to be a food spoilage organism. | Dichloran Rose Bengal Chloramphenicol Agar is a commercially specialist culture medium for viable yeasts and moulds in food products. It incorporates Rose Bengal, which both helps limit colony size and is selective against bacteria. |
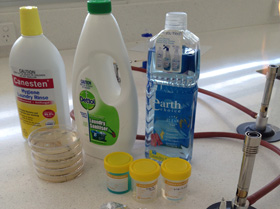
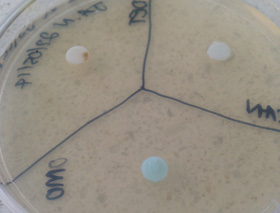
Effects of different anti microbials on bacterial growth
Joseph Lister first introduced aseptic surgery in 1867 when he used a spray of carbolic acid (phenol C6H5OH) as a germicide. He was able to reduce mortality of post operative surgery by up to 45%. Since then the control of growth by antimicrobial compounds has grown into a multi-billion dollar industry. A good student experiment is to assess the effect of a variety of antimicrobial disinfectants on bacterial growth.
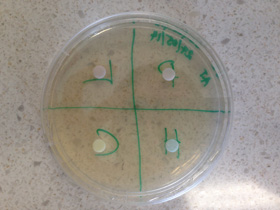
Charmaine Keal (HOD - Science at Tullawong State High School) offered this advice: "the most popular is testing the effects of different anti-microbials on bacterial growth. Our labbies prepare the plates and order in E.coli. Students then put a 'wash' of E.coli on the agar. Small paper discs (like out of a hole punch) are sterilised and then soaked into different anti-microbials. The discs are placed onto the agar plates and then into the incubator for a couple of days. If the anti bacterial is effective there is a clear ring around the disc where the E.coli have not grown. Students have used the width of this ring to indicate effectiveness (and to collect quantitative data). The experiment can work quite well; keen students have then researched the active compounds within the antibiotic, how they act upon the bacteria and link to the results observed".
Common antibacterials are alcohols (eg ethanol, isopropyl alcohol), synthetic detergents = QAC (quaternary ammonium compounds) or phenols. No single disinfectant is ideal. Each has its advantages and disadvantages. For example, phenols sterilise well but are corrosive and toxic. Detergents and 70% alcohol have some microbiocidal effect but are not sporicidal and dry out skin surfaces. At Mt Maria College, Enoggera, Brisbane, the Science Co-ordinator Shan Wainwright also uses multi disks impregnated with antibiotics. Risk assessment including disposal of waste is vital.
 |
 |
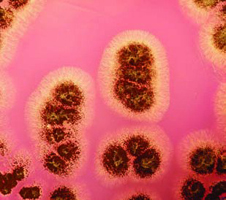
| This photo shows zones of inhibition around filter paper disks saturated with anti-microbial compounds. The diameter of the zone of inhibition is a measure of the effectiveness of an anti-microbial compound. | Mounting concerns over the potential for microbial contamination and infection risks in the food and general consumer markets have led to increased use of antiseptics and disinfectants by the general public. Despite this, much is still to be learnt about the mode of action of these active agents on bacteria such as those shown above. |
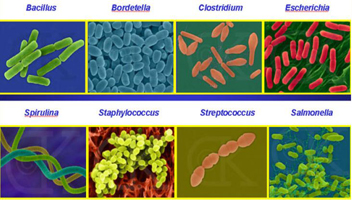
The images in the diagram to the right were prepared by Dr Dennis Kunkel of Dennis Kunkel Microscopy Inc. using light and electron microscopy. Over years Dennis has assembled a vast collection of these micrographs, many of which have been colorized and can be viewed on his website. Images Copyright Dennis Kunkel Microscopy, Inc. used with permission.
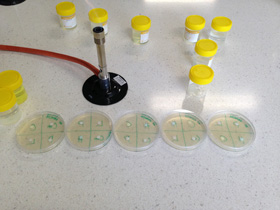
Some photos below taken from the student experiment of a Yr 12 Biology student at Our Lady's College, Annerley, Brisbane.
 |
 |
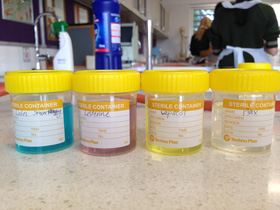 |
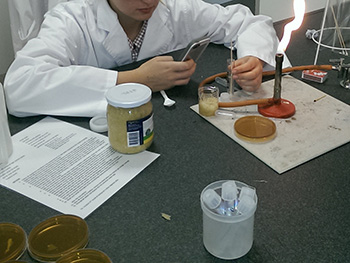
| Some of the antiseptic products being tested by Jamie at Our Lady's College, Annerley. | Bunsen for updraught. | Sterile containers are a must. |
 |
 |
| The filter paper discs soaked with the antiseptic solution. | My thanks to Jamie at Our Lady's College for sharing her Yr 12 Biology student experiment photos. |
Do probiotics survive the digestive tract as claimed?
The following suggestion is courtesy of Adam Delroy, Moreton Bay College, Brisbane.
Probiotics are live bacteria and yeasts that are good for your health, especially your digestive system. We usually think of bacteria as something that causes diseases. But your body is full of bacteria, both good and bad. Probiotics are often called "good" or "helpful" bacteria because they help keep your gut healthy.
Probiotics are naturally found in your body. You can also find them in some foods and supplements (eg Yakult, Inner Health Plus, Greek yoghurt). Supposedly they can lower the amount of "bad" bacteria in your digestive system that can cause infections or other problems. However, are probiotics able to survive the pH variations of exposure through the intestinal tract to offer health benefits?
 |
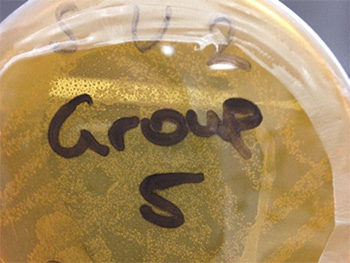 |
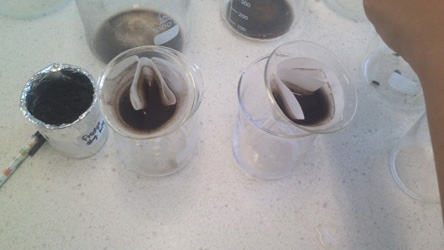
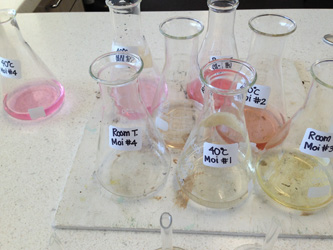
| Year 10 student Megan prepares the probiotic solutions at different pHs. She is photographing the tubes, so she said. Instructions (method) for students can be downloaded here. | After 3 days in the incubator, there was growth on many (but not all) plates. This one shows the growth of the oesophagus "low pH" (pH 4.0) bacteria. |
In the task we use for the Year 10 Technology & Applied Science extension classes at Moreton Bay College, students were able to select a probiotic (either Lactobacillus acidophilus probiotics or Bifidobacteriam probiotics) and test whether these microbes are able to survive the pH exposures found in the mouth, oesophagus, stomach, proximal and distal small intestine and large intestine to offer their health benefits.
The task sheet, prepared by teacher Adam Delroy, can be downloaded here. After trying a general purpose nutrient agar medium, growth was very poor so a lactobaccilus-specific medium was tried (MRS Agar from Thermo Scientific). This worked well. Details are available here. The MBC microbiology laboratory protocols can be downloaded here.
Killing black mold with clove oil
After the Brisbane floods of January 2011 thousands of homes were affected by mold (or "mould") growing on walls, ceiling and carpets. Flood waters are known to contain viruses, molds and bacteria that can easily become air borne, and combined with sewage and toxins in flood waters this makes a dangerous combination. Even after flood waters recede, the residue left behind contains the same micro-organisms. Insurance companies wouldn't bother to clean moldy carpets because many molds produce mycotoxin which is very dangerous for humans as well as animals. Tightness of the chest, cough, nose bleeds, fever, headache, flu, etc. are some of the most common health hazards of this mold. In fact, the Queensland floods saw seven people hospitalised with the deadly bacterial infection Leptospirosis, due to the micro-organism Leptospira borgpetersenii (serovar Arborea); and it was the first time it had been seen in central Queensland. Click the link for the abstract of an article about it published in Epidemiology and Infection (V141, No. 3, Marr 2013, 585-590) by J. K. G. Smith, M. M. Young, K. L. Wilson and S. B. Craig - scientists from the Queensland Department of Health.
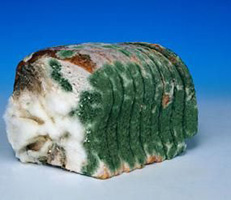
One common way to get rid of mold is to wash the affected area in a clove oil solution. This suggests a good student experiment with great practical significance. You could grow some mold on bread (such as the black-green mold pictured below) and place a few drops of a solution of it on a nutrient agar plate and then incubate it. Measure the size of the colony after a few days and then place a square of filter paper on the agar with various amounts of clove oil added and note the growth over the next week. As another treatment you could add the clove oil filter paper at the time of innoculation. How much clove oil to use? Try trial and error but Shannon Lush, in her book "Spotless", suggests a solution of half a teaspoon of oil (2.5 mL) of clove oil (from a pharmacy, supermarket or health food store) to 1 litre of water will kill the spores 24 to 48 hours. Be warned: you will need to consider health risks before you get started, and your teacher will need to approve your plans.
Year 12 student Mitchell Oxley from Redlands College, Brisbane, found this was too weak and stepped it up by a factor of 10. Another favourite is cinnamon oil; you could try that too. If you want to control the type of mold present - and consider the naturally occuring molds too haphazard - then you could consider buying a specific strain. Southern Biological from Brisbane supplies Penicillium chrysogenum as a safe alternative for use in schools. It costs about $15 and comes in a malt extract agar.
 |
 |
 |
| Mold growing on the walls after a flood. Clove oil is one way to remove it although some expert cleaners prefer bleach or hydrogen peroxide. | Black mold (dark green to black) growing on bread. Just seal a slice of bread in a plastic bag with a few drops of water and wait a few days. | Place the mold solution on a nutrient agar plate and incubate for a while. You can see the oil-impregnated filter paper square has killed off the mold. |
 |
 |
| Top and bottom view of Penicillium chrysogenum growging on nutrient agar. Photo courtesy of Mitch Oxley. | Growth of molds at different concentrations of clove oil ranging from zero on the left to 100% oil on the right. |
Factors affecting enzyme function
Tullawong SHS has their Year 11 Biology students perform the experiment titled "Break it down" (Biology One Activity Manual, p124 - 128) as an introduction to an enzyme digestion of starch student experiment. Once the experiment is completed, students are required to design and conduct a modification to this experiment for their student experiment whereby they investigate one of the variables that affects the rate of digestion in animals. Click this link to download their Yr 11 Starch student experiment task sheet.
This approach is fairly common in Year 11 as it allows students to concentrate on particular aspects of the student experiment and to develop investigative techniques prior to an "open inquiry" approach in Year 12. Click this link to download their Yr 12 Open Inquiry student experiment task sheet. Note: the school limits task sheets to two pages thus other support material is handed out separately. For example: Click this link to see their Year 12 student experiment Report Guidelines. My thanks to Tullawong SHS Biology teachers: Charmaine Keal (HOD Science), Miriam Kissane, Carey Kearney and Shannon Trims.
 |
 |
|
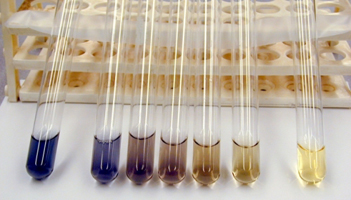
| When starch is present, iodine is dark blue. If the blue colour lightens or disappears, this indicates starch is breaking down. | Factors such as temperature, pH and concentration can affect the rate of breakdown of starch as shown in the series above. The problem is - how do you quantify the degree of breakdown? |
Enzyme functioning
All Hallows' School, Brisbane, runs an open inquiry student experiment in Year 12 around the topic of enzymes. During the study of 'Functioning Organisms', students conduct an student experiment to engage with an aspect of plant or animal physiology that allows optimal homeostatic levels to be maintained.
Whilst students may choose various aspects of physiology, such as rates of photosynthesis or respiration, membrane permeability or diffusion rates, a popular experiment involves enzyme activity. The students select an enzyme to investigate, which they research in order to learn how that enzyme contributes to homeostasis, particularly within humans. An example here may involve the use of Bromelain found in pineapples to assist in the digestion of proteins. Students then conduct a number of trials involving their enzyme and a key substrate which they can link to physiology.
The time-consuming nature of the practical work and the difficulty in obtaining quantitative results are often offset by the quality of scientific techniques required, the scope for constant improvement of the method and the creativity required to transform qualitative results into a quantitative scale in order to make meaning of the results. Biology teacher Linda Anderson has supplied the task in OneNote format and can be downloaded here and edited. It is also available in pdf format. Please note that some references apply to the All Hallows' intranet and will not be available. A suggested list of enzymes and procedures for making them up is also available from Linda for download. Photos from her students' student experiments follow:
 |
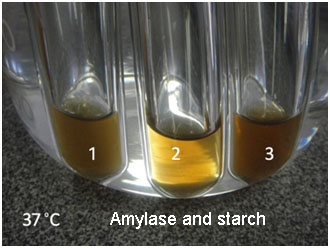 |
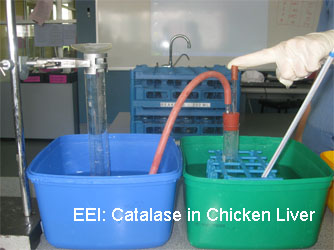
| The conditions of this experiment included the study of the effects of temperature change, varying pH and varying substrate concentrations on the amount of catalase found in chicken liver. | This experiment involved varying the amount of amylase to determine the effect this has on the speed of starch break down. |
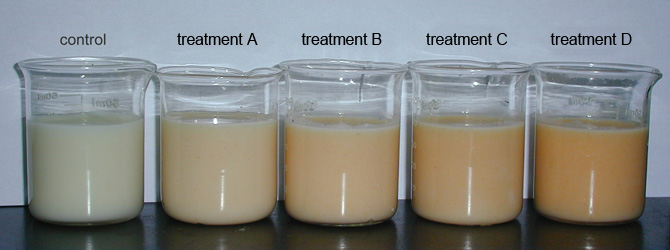
The final experiment shown in the photos above (far right) involved examining the effect of lipase on the emulsification of fat through testing the rate of emulsification of the different rates of digestion when varying the fat content of the milk. Alternatively, some students examined the effect of the emulsification of fat through the use of different quantities of dishwashing liquid to mimic the act of bile salts to see what effect this has on the speed of the reaction.
Digestion of milk
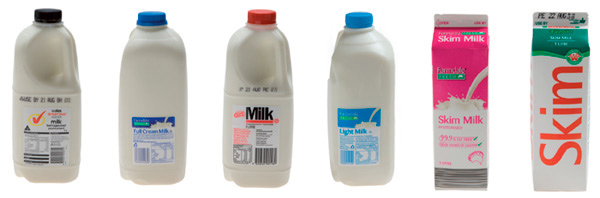
Are there health implications of consuming large quantities of full cream milk? Should low fat milk be accessible in school tuckshops? Should flavoured milks be made with low fat milk? Does the addition of certain minerals affect the digestion rate of milk, such as PhysiCAL?
 |
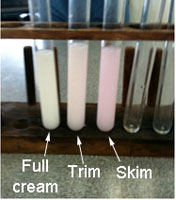 |
| CHOICE says: Despite the profusion of brands and the plethora of claims, the only really meaningful choice when buying milk is between full-cream, low-fat and skim, as the generic brands are little different from the more expensive national brands. | The effect of lipase on the emulsification of fat. |
Lactic
acid and the fermentation of milk
Lactic acid forms in milk due to the action of fungi and bacteria acting on
the lactose sugar. The most important lactic acid producing bacteria is
Lactobacillus. The presence of lactic acid, produced during the lactic acid
fermentation is responsible for the sour taste and for the improved
microbiological stability and safety of the food. A good student experiment might be to
investigate the factors influencing the rate of formation of lactic acid upon
the addition of some starter bacteria (eg plain yoghurt). I
won't say what they are but a couple of the following are suspects: heat, amount
of bacteria added, light,
access to air, shape of container, sugar concentration, initial pH, amount of
fat (normal, low fat, skim), degree of agitation, and so on.
The acidity of milk is sometimes measured by titration with a 0.1 M NaOH solution, and indicates the consumption of NaOH up to a phenolphthalein end point. People sometimes wrongly assume that the "titratable" acidity is due to lactic acid - an organic acid with the formula CH3-CHOH-COOH. However, fresh milk contains practically no lactic acid and the consumption of NaOH is used to change the pH-value of the following components: carbon dioxide, citrates, casein, albumin and phosphates which gives the appearance of a lactic acid concentration of about 0.13% The determination of "acidity" in fresh milk by means of titration is therefore more a measure of the buffer action of milk than anything else. You would call this the "initial" acidity.
In an student experiment, it is likely that you want to talk about the "developed acidity",
which is the result of bacterial activity producing lactic acid during milk
collection, transportation, and processing. You measure "titratable acidity" (rather than calling it "lactic acid
concentration") but acknowledge the errors and subtract the initial "acidity"
from the subsequent values obtained during the experiment. Be careful if you
intend to measure titratable acidity as a function of time eg "time elapsed"
(rather than just as a function of some manipulated variable (such as
temperature). See the note that follows. As a rough guide, one of my students measured the titratable acidity of milk as 0.0288M as lactic acid (7.10 mL titre) at the start, and on day 7 the value was 0.0815M (15.65 mL titre). The in-between values did not give a linear graph; it had a nice curve.
 |
Note about identifying variables:
"time elapsed" can be a controlled variable or independent variable (or both) in this experiment (and others that involve collecting data
over a period of time).
CASE 1: In the fermentation experiment you may, for example, choose to have the "temperature" as the independent (manipulated) variable (say 0°C,10°C,
20°C,
30°C...)
and "titratable acidity" as the dependent variable. If these are measured just once, say after 1
week, then "time" is a controlled variable (along with initial
pH, sunlight,
sugar concentration, aeration, exposed surface area etc). You could prepare a graph where you plot
"titratable acidity" (y-axis) and temperature (x-axis)
and there will be one line.
CASE 2: However, "time" can be an independent variable as well. You use the "temperature" as the independent variable but if you measure the dependent variable (titratable acidity) every week at 0, 1, 2 and 3 weeks then you really have two experiments in one. There are two independent variables: "time" and "temperature" but they can be examined separately. A plot of titratable acidity (y-axis) vs time (x-axis) would show 4 lines (if you used 4 different temperatures). This would be most valuable as it would show you the fermentation rate at each temperature.
You could prepare another graph where you plot titratable acidity (y-axis) and temperature (x-axis) to get 4 lines (one for each weekly measurement including the titratable acidity at t=0). This would be harder for you to visualise and interpret however. The two graphs together could be analysed "... to identify relationships between patterns, trends..." IP3 (VHA) and "analysis and evaluation of complex scientific interrelationships" (EC1, VHA). The two graphs provide stronger evidence for inter-relationships than either graph alone.
Which ferments best: glucose, fructose or sucrose?
Another terrific idea for a wine student experiment. The two common fruit sugars used in winemaking are glucose and fructose. Grape juice is made up of these in roughly equal quantities. Another sugar used in the fermentation industry is sucrose (cane sugar). Sucrose is frequently used as a cheap carbohydrate by breweries, wineries and other fermentation-based industries employing yeast. It is a di-saccharide composed of D-glucose and D-fructose linked by an alpha-1,4 glycoside bond. In the initial stages of fermentation, sucrose is rapidly hydrolyzed into glucose and fructose by the action of the enzyme invertase on this bond. Then the sugars are transported across the cell membrane where they ferment and form alcohol. So investigating the fermentation of sucrose is really also about studying the fermentation of a mixture of glucose and fructose. This suggests a terrific student experiment: to look at the reaction rates of glucose, fructose and sucrose. I am indebted to Savannah from Coolum State High School for suggesting this to me.
 |
 |
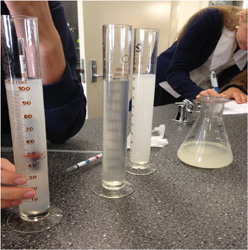 |
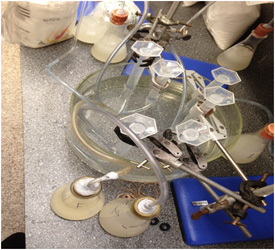
Savannah's photos: Gases from the three fermenters was captured and measured using water displacement in measuring cylinders. |
Glucose fermenter. May 2014. |
Measuring sugar concentration with a Brix hydrometer. |
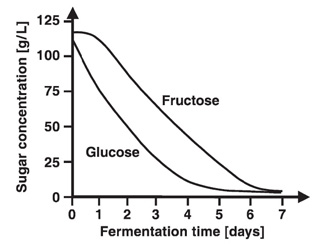
At the start of fermentation, grape juice contains approximately equal amounts of glucose and fructose (called 'hexose' sugars). While both are fermented by wine yeasts to ethanol and carbon dioxide, Saccharomyces cerevisiae consumes glucose faster than fructose because this yeast is know to prefer glucose (and so is called a glucophilic or ‘glucose-loving’ yeast). As fermentation proceeds the ratio of fructose to glucose increases. Therefore, fermented grape juice will contain more fructose than glucose as residual sugar. Fructose is the sweetest hexose sugar, approximately twice as sweet as glucose, and thus the wine gets an undesirable fructose sweetness, unbalanced by the sweetness of glucose.
 |
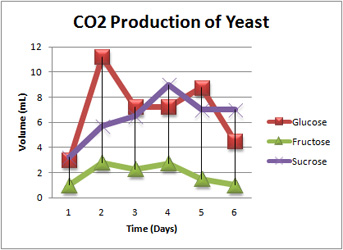 |
| Source: Rodicio, R. Heinisch, J.J. (2009). Sugar metabolism by Saccharomyces and non-Saccharomyces yeasts, chap. 6, pp. 113-134. Springer-Verlag Berlin Heidelberg. | Savannah's results from her Coolum State High Year 12 Chemistry student experiment. |
So here is the starting point if you are doing an student experiment. Pose the Research Question: "How do the fermentation rates of glucose, fructose and sucrose compare?" Potentially it is a fantastic student experiment. Studies have found that glucose and fructose ferment at equal rates when they ferment separately; and when their concentrations are above 1%. However, when the glucose is below 1% it reacts faster than fructose. One delicious complication though is that when glucose and fructose are mixed (as in the case of fermenting sucrose; or in an artificial mixture) the glucose ferments faster than fructose. Glucose seems to inhibit fructose. Hmm – now that is tricky.
Your student experiment could look at the fermentation rates of glucose and fructose separately - keeping everything the same except the independent variable of initial concentration. Note that 1% seems to be some sort of cut-off so examining concentrations either side of this would seem laudable. An then look at a mixture - or just look at sucrose as a natural mixture. What are you going to measure? The progress of the fermentation can be assessed by measuring the concentration of residual sugar or of the ethanol, or by the amount of CO2 produced. Sugar concentration can be measured using a Brix refractometer; or in the case of the two reducing sugars glucose and fructose, you can do a Fehling's titration; and there is a titration for ethanol. The density can also be used as an index. You could also monitor the reaction with a gas pressure sensor. I've used the Vernier sensor with a Texas CBL2 and that works well. There are lots of other gas sensors too.
A good start into the experimental glucose/fructose/sucrose fermentation is Leanie Mocke's 2013 Master of Science (Biochemistry) Thesis from Stellenbosch University, South Africa entitled Kinetic Modelling of Wine Fermentations: Why Does Yeast Prefer Glucose to Fructose? [available on-line].
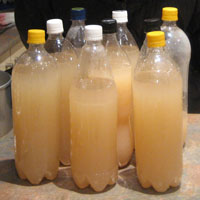
Ginger Beer - avoiding the headaches
Investigating the production of alcohol in wine can give you a few headaches - particularly if you think someone will drink your experiment. Dr Gary Turner, HoD Xavier Catholic College (Hervey Bay) suggests that for Chemistry student experiments a good alternative is ginger beer using a 7-day fermentation recipe (see later). This may be also suitable if your school doesn't allow you to have alcoholic beverages on campus - even in an experiment.
Ginger beer is made traditionally by the yeast fermentation of a mix of sugar, water and ginger. It is rarely produced commercially but often home brewed. The beverage produced industrially is generally not brewed (fermented), but carbonated with pressurized carbon dioxide. It is really just a soft drink, sweetened with sugar or artificial sweeteners. However, there are some manufacturers who still brew it the old way: in Queensland, Bundaberg Brewery produces an excellent brewed ginger beer. It is cloudy and if you hold the bottle up to the light and you'll see it's full of ginger pieces. A good student experiment would be to brew your own at home or in the lab using one of the many recipes available on the internet (but do NOT drink it; not for an student experiment).
 |
 |
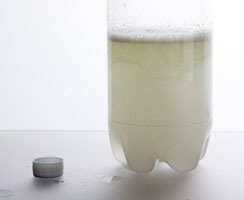 |
| Bundaberg Brewing uses the real ginger 'bug' plant. | Brew up some batches in the school lab - but don't drink it. | The suspended yeast makes it look cloudy. |
Gary suggests this for his Year 12 student experiment: First: You will be following a 'standard' procedure for making a simple beer (e.g. two-day ginger-beer) to give you the background skills and chemistry involved in making a beer, and to explore the factors involved. This section of the work will also require you to define which factors you can reasonably test in a school-laboratory, and which variables in the production that you can vary. A copy of the student experiment task sheet is available for download here.
"The students can try the variables of yeast, sugar, and temperature (by dividing batches into samples) and titrate for alcohol at intervals (many hands makes light-work). You need a fridge and an incubator to give you three temps (including room temp) for the temp-as-variable". His method is one of many that can be easily obtained from the internet:
You need to create what is called a Ginger Beer Plant. Put 15g of general purpose dried yeast into a large jar or bowl, add 300mL water, 2 teaspoons ground ginger and 2 teaspoons sugar. Cover with a sheet of cling film and secure with a rubber band. Each day, for seven days, add 1 teaspoon of ginger and 1 teaspoon of sugar to the mixture in the jar. Now strain the mixture through a piece of fine muslin and add the juice of two lemons to the liquid. Add 50g or sugar to the liquid and make up to 4.5 litres with cold water, stirring to dissolve the sugar. Bottle into a plastic bottle Keep for 7-10 days when the ginger beer is sparkling and ready for drinking. You can keep the sediment that you have left after straining the ginger beer plant. Divide into two jars and give 1 plant away to a friend with the instructions. To the sediment add 300 mL water, 2 teaspoons sugar and 2 teaspoons ginger and carry on as before. |
Alcohol is produced but its concentration is likely to be under 1%. Also, most fermented soft drinks are acidified to inhibit bacterial growth. Does this also inhibit the yeast? You could investigate the effect of pH on the rate of fermentation using lemon juice or better - citric acid. The juice of 1 lemon contains about 12 g citic acid. Be warned - you should not be drinking the ginger beer unless you have approval from your teacher (and this is unlikely). Drinking stuff made in a laboratory with no hygiene controls is DEFINITELY NOT PERMITTED.
Lastly, what sort of yeast is best? Chemistry teacher Torsten Pluschke of Atherton State High School (North Queensland) said that you could buy genuine ginger beer plant (a SCOBY - symbiotic colony of bacteria and yeast, rather than just baker/brewer's yeast) online. He said that it must be looked after, and consumed in a shorter time frame than baker/brewer or wild yeasts. One online site (no recommendations given though) is The Ginger Beer Plant who can provide a 50 g sachet of the SCOBY for about $20 including postage to Australia. I asked at my local brew shop and the guy said none was available in Australia and it had to be bought online.
However, what yeast do you think Bundaberg Brewed Drinks use for their Brewed Ginger Beer? Here's what Richard Cowdroy-Ling, General Manager Business Technologies, said about their product:
We use a standard bread yeast for the Ginger Beer and in the sparkling fruit range we use various yeast from the wine industry depending on the flavour we are chasing. In the interests of maintain a pure culture and having good control of the process for quality issues we have stayed away from the mixed cultures of yeast and bacteria [scoby] and continue to use fresh yeast for every batch. We have previously trialled a "ginger beer plant" culture in our laboratory from the UK - that was several years ago - but without much success and the flavour was not any better than on the baker's yeast that we use now. |
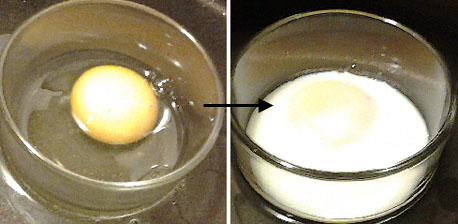
Denaturing albumin 'egg white' with copper
'Egg white' is the common name for the clear liquid contained within an egg. It is also called the albumen or the glair/glaire. When cooked, the albumin turns white and opaque. It is said to have been denatured. Many processes (eg beating) can denature albumin. So too can chemicals. One such chemical is copper sulfate. The copper ions break down the tertiary structure causing the protein to denature. The higher the concentration of the copper sulfate the faster and more opaque the albumen will turn. A practical example of this is the use of copper bowls to stabilize egg foams. The copper in the bowl assists in creating a tighter bond in reactive sulfur items such as egg whites.
 |
 |
| This photo shows a just-cracked egg with its clear albumin, and a second photo after the albumin has been denatured by heat. You can see how it has gone white and opaque. Copper ions will do this as well as dozens of other chemicals. | French chefs have used copper bowls for beating egg 'whites' since the early 1700s |
A good student experiment would be to see how the concentration of copper sulfate solution affects the degree of denaturing. I would start with copper ion concentrations ranging from 0.002M to 0.01M CuSO4. If you don't do chemistry then perhaps you could find out what the "M" concentrations mean, or just do it as grams/litre. A 0.001M solution of copper sulfate pentahydrate (which is what you'll have in the lab) is made up of 0.250 g/L. For chemistry students, note that the molar mass of the pentahydrate is 250g/mol. One way of obtaining quantitative results is to centrifuge the solutions after denaturation has occurred and this will show how much of the albumen has been denatured. The centrifuge tubes are usually graduated.
Nitrification in Soils - a great titration prac.
A great student experiment concerns the process of nitrification by soil bacteria. It would be suitable for either Chemistry or Biology. It is also broadly related to wastewater treatment and maintenance of fish aquariums.
Nitrogen is one of the most essential nutrients for plants and is most frequently the limiting factor in crop productivity. The vast majority of the total nitrogen in soil (>98%) is in organic matter, which can't directly be used by plants. It must be converted to inorganic forms as either ammonium (NH4+) or nitrate (NO3-). This conversion occurs via a biological process called nitrification involving soil microorganisms.
Nitrification in nature is a two-step oxidation process of ammonium ion or ammonia to nitrate ion catalyzed by two types of bacteria. The first reaction is oxidation of ammonium to nitrite by ammonium oxidizing bacteria (AOB) represented by the Nitrosomonas species. The second reaction is oxidation of nitrite (NO2-) to nitrate by nitrate-oxidizing bacteria (NOB), represented by the Nitrobacter species.
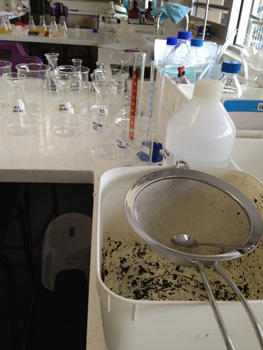
The progress of nitrification can be investigated using a fairly common titration procedure. It involves making a filtered solution of the soil, boiling off free ammonia, adding an excess of sodium hydroxide solution (which reacts with the ammonium ion) and back-titrating the excess hydroxide with standardized hydrochloric acid. The method can be easily found on the internet and may even be in your textbook under a heading of "analyzing fertilizer". The photos below are courtesy of Yr 12 student Jamie from Our Lady's College, Annerley, Brisbane.
 |
 |
 |
| Sieving gets rid of the larger bits of organic matter. | Weighed and ready to go into the incubating flasks. | Getting ready for titration. Yr 12 students in the Chem/Biol lab at Our Lady's College, Annerley. |
A good mixed source of nitrifying bacteria and ammonium ions is potting mix. It usually contains peat moss, sand, and other organic material such as wood chips. It usually has reasonable amounts of ammonium ions present. Your student experiment could be to measure the ammonium ion concentration after a period of time (say a week) under different conditions that may affect the bacteria (temperature, oxygen availability, pH, salinity, light).
 |
Filtering the soil and water mixture. The filtrate contains the soluble ammonium ions that are to be titrated. |
Temperature: nitrifiying bacteria are supposed to be at their optimum from 25°C-30°C. Aquarium operators have a rule of thumb that says: 50% activity at 20°C, 25% at 10°C, 0% at 4°C and are death at 0°C. When heated, their activity decreases after 30°C and they die by 50°C. That suggests a great investigation.
Oxygen: the bacteria need oxygen to produce energy to live (respiration). If you cut off their oxygen supply their activity decreases. Farmers know that in waterlogged soils the bacteria are less productive. That suggests waterlogging your potting mix samples to prevent the bacteria getting oxygen and comparing them to the control. It would be good to know how much water is present in the potting mix and you can do this by taking a weighed sample and drying it in the oven at 100°C (gravimetric analysis).
Moisture: nitrifying bacteria are most active in a soil that is moist but not saturated (see above). Is there an optimum amount of moisture? If completely dry they go into hibernation - but what is optimum?
pH: there is an optimum for the first stage bacteria (nitrosomanas) of 7.8 to 8.0, and for stage two (nitrobacter) it is a little bit less. This investigation would require careful design. Potting mix is usually pH 5-6.5 so you'll have to add some alkali to increase the pH. This will affect the acid/base titration. You'll need to think about a controlled sample without potting mix but with the added base. As a matter of interest, as the ocean becomes enriched in anthropogenic (human activity) CO2 the resulting decrease in pH could lead to decreasing rates of nitrification. That's another context for this student experiment.
Salinity: the optimum is said to be zero to 0.6%.
Light: the nitrifying bacteria are supposed to be sensitive to blue/UV light. But how far into the soil would light penetrate (a good design consideration).

My thanks to Chemistry colleague at Our Lady's College, Annerley, Brisbane, Kayleen Solomon and Yr 12 student Jamie for providing ideas and photos for this student experiment suggestion.
Nitrification in Soils - spectrographic determination
In the above suggestion, a back titration was used to determine the ammonium concentration. If you have access to a spectrophotometer and the reagents required you could determine nitrate ion spectrophophotometrically.
Physically, nitrite is a colorless and odorless ion. However, there are spectrophotometric methods for its determination. One example is to react it with an acidified sulfanilamide and N-(1-naphthyl)ethylenediamine dihydrochloride to form an intensely coloured dye having maximum absorption at 540 nm. There are lots of other methods. Often you can get them in the form of test kits where you compare the colour to a test strip. Before you get started check that you can get the reagents.
Soft Drinks and Tooth Decay
 Soft drinks consumption has risen dramatically over the past 40 years and so has the resulting incidence of rotting teeth and osteoporosis. Does this sound like a fun context for a biology experiment? The photo to the left shows perfect teeth. If I used a photo of rotting teeth you would feel sick.
A soft drink ( or 'soda') such as lemonade or Coca-Cola is a drink that does not contain alcohol, as opposed to a hard drink, which does. Australians consume about 300 mL of soft drink per day on average but amongst 14-16 year olds the figures are 1000 mL for males and 500mL for females. Soft drinks are about 10% sugar so a young male typically consumes 27 teaspoons of sugar per day in soft drink; a girl, about half that. Just one can of soft drink has about 10 teaspoons of sugar in it. The resultant obesity (fat) epidemic is attributed in part to soft drinks. Health risks from over consumption include diabetes, kidney stones, obesity, osteoporosis, and tooth destruction.
Tooth decay is partly from the bacteria feeding on the sugar but also from the acids reacting with the tooth enamel. The citric or phosphoric acid in soft drink dissolves the calcium out of the enamel leaving a softened matrix for bacteria to enter the teeth and cause wholesale carious (tooth) destruction. So drinking sugar-free (diet) soft drink is not the answer.
A good student experiment may be to look at the effect of drink acids on teeth. Teeth are a form of hydroxyapatite Ca5(PO4)3(OH) but you can simulate this in the lab with calcium carbonate (marble chips). The problem is: you need to control the type of acid, whether it is phosphoric acid as found in cola drinks, or citric acid as found in lemonade. A study by Fraunhofer and Rodgers (2004) found that the rate of enamel dissolution of teeth was not dependent on pH but may be affected by titratable acidity. Remember that weak acids (phosphoric, citric) are not fully dissociated in water (so their pH is not that low) but they gradually release more hydrogen ions as they react. The "titratable acidity" will be a measure of this. Citric acid, for instance, is a tribasic acid which releases its H+ ions in four steps. It has a reversible reaction with CaCO3 and the reaction is controlled by diffusion of reaction products away from the 'tooth' surface; thus, consider keeping it stirred.
 |
|---|
| The study by Fraunhofer & Rodgers (2004) found that Coke was not as aggressive as lemonade in enamel dissolution. In fact, Mountain Dew had the greatest impact of all. |
As a trial, I took a 1 cm3 cube of marble and placed it in 200 mL of 7.5%w/v citric acid solution (pH 1.8) at 50°C (with stirring) and after 60 minutes it had lost 0.30 g. Why not make up a synthetic soft drink from phosphoric or citric acid. What concentration will you choose? How does the reaction rate or the extent of the reaction vary with concentration? Does temperature have much effect on the rate? Does the product - calcium citrate or calcium phosphate - impede the progress of the reaction; that is, how soluble are the products (one is 4 times as soluble as the other). How do you measure the progress of the reaction (amount of carbonate consumed or change in titratable acidity of the solution)? Oh, the possibilities are endless. And you can drink the left-over Coke and rot your teeth a bit more at the same time. A great student experiment.
SOME OTHERS
These below were provided by John Andrews (HOS Science, Matthew Flinders Anglican College, Buderim). They have been taken from his Year 11 Biology task sheet. This task sheet shows numerous suggestions also listed on this webpage but also shows his approach to scaffolding Year 11 experiments. The pdf file may be downloaded here.
- Effectiveness of biological washing powders in removing protein stains.
- Different types of food-processing in relation to shelf-life.
Schools have a variety of sensors to get quantitative data about plant growth and behaviour. For example, at Clairvaux MacKillop College, Diane Mackenzie said that in Year 11 student experiments they focus on plant physiology and use a collection of sensors that includes oxygen, CO2, relative humidity, gas pressure, colorimeters, pH and conductivity and students are encouraged to use these in designing and carrying out experiments mainly related to rates of photosynthesis, respiration, transpiration and germination.
What are the "best" conditions for growth of a plant?
There have been about 7000 generations of humans on this planet so far but in only ten of these has there been enough food for the majority of the population in the western world. In 18th Century Britain 20% of the population was not fit to work because of lack of food; they only had enough energy to stay alive. In the 21st century we now have four times as much energy available for work (8000 kJ against 2000 kJ back then). Much of this change has come about by food scientists and farmers working together to maximize the yield of crops.
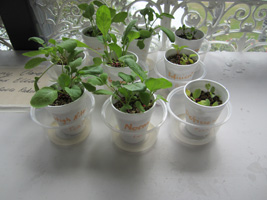
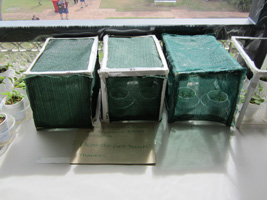
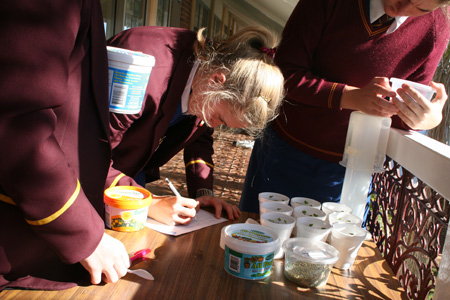
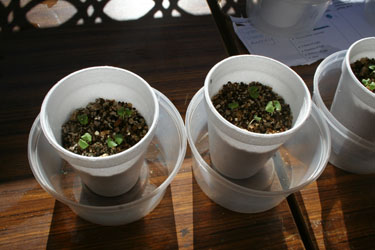
Now, as the world population continues to grow, scientists are looking for the 'best' way of producing food. Using punnets of impatiens cuttings, chervil, basi or radish, for example, as a starting point you could investigate a variety of factors known to affect plant growth. In schools, the most common ones are:
Use shadecloth (90% shade, 50% shade, 0% shade ie full sun). For radish typical results are 90% 2.5cm growth in 3 weeks, 50% 5.0 cm; full sun 5.7 cm. Foliar absorption Under normal growing conditions plants absorb most nutrients, except carbon, hydrogen, and oxygen, from the soil. However, some nutrients can also be absorbed by the leaves if they are sprayed on with a dilute solution.
Basil are better for student experiments done in the warmer months but if you want to do it in winter (as most schools do), then chervil (Anthriscus cereifolium) - the french herb - or radish seedlings are great (see photos below).
Moreton Bay College has used radish for the past few years and have found them to be the best for student experiments. They used to get their chervil seeds from Beautanicals at Helidon, a few hours west of Brisbane, phone 07 4697 6306 or email seeds@beautanicals.com.au. They are great to deal with and 30 fresh seeds cost $3.50. Click here to download Moreton Bay College's Yr 11 student experiment. The Biology teachers from Nanango State High School have also provided their Year 11 student experiment on plant growth: Click here to download Nanango SHS's Yr 11 Plant Growth student experiment.
 |
 |
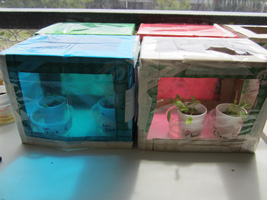 |
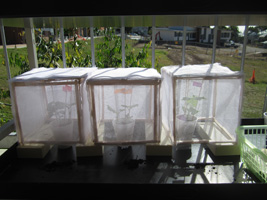
| Radish seedling are great for a winter student experiment. Here they are given different nitrate treatments (high, medium, low). The "medium" seem healthiest. Question: how do you quantify "growth" without killing the plant (height, number of leaves, size of leaves, amount of ....)? | At Moreton Bay College one of the treatments for radish seedlings was the amount of light. This was varied by use of shade cloth. Hint (from bitter experience): the same person should be the observer for any one variable. | In this student experiment the variable is the colour of the incident light. Blue seedlings look sick, but the red aren't too bad. The problem is how to control the intensity of light as well as the colour (wavelength). See below. |
 |
 |
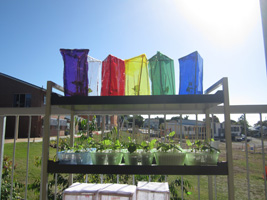 |
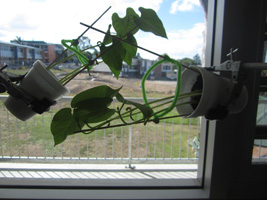
| Geotropism at Our Lady's College, Annerley | Light Intensity using mosquito netting - Our Lady's College | Colour - Our Lady's College |
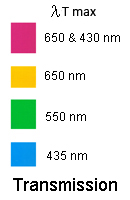
Your problem will be to ensure the same intensity of light gets through to the plants (yellow may not absorb as much as blue for instance). The image below shows the wavelengths of light most transmitted (passed) by each type of cellophane; this is called their "λTmax" (lambda T max), that is, the wavelength most transmitted. I did this on a spectrometer at Moreton Bay College but you could run them again if you can get access to a spectrometer. You would also need to know what % transmission occurs for each colour; I didn't do that.
VARIABLES
Note about identifying variables: "time elapsed" can be a controlled variable or independent variable (or both) in this experiment (and others that involve collecting data over a period of time).
CASE 1: In this leaf growth experiment you may, for example, choose to have the "amount of fertilizer" as the independent (manipulated) variable, and "leaf surface area" as a measure of growth for the dependent variable. If these are measured just once, say after 3 weeks, then "time" is a controlled variable (along with water, sunlight, temperature etc). You could prepare a graph where you plot surface area (y-axis) and concentration (x-axis) and there will be one line.
CASE 2: However, "time" can be an independent variable as well. You use the "amount of fertilizer" as the independent variable but if you measure the dependent variable (surface area) every week at 0, 1, 2, 3, and 4 weeks then you really have two experiments in one. There are two independent variables: "time" and "amount of fertilizer" but they can be examined separately. A plot of surface area (y-axis) vs time (x-axis) would show 3 lines (if you used 3 different concentrations of fertilizer). This would be most valuable as it would show you growth rate at each concentration. You could prepare another graph where you plot surface area (y-axis) and concentration (x-axis) to get 5 lines (one for each weekly measurement including the starting height at t=0). This would be harder for you to visualise and interpret however.
The two graphs together could be analysed for inter-relationships "to identify trends and inter-relationships" IB3 (VHA) and "interpreting and critically analysing results with links to theoretical concepts to draw conclusions" (IB4, VHA). The two graphs provide stronger evidence for inter-relationships than either graph alone. I strongly suggest you consult your teacher about getting the best opportunity to demonstrate an "A" grade, particularly in the two criteria mentioned above (IB3, IB4).
 |
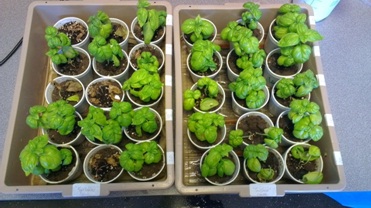
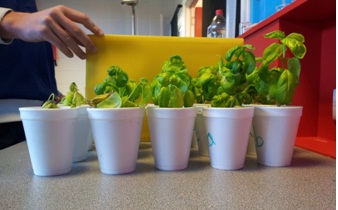
 |
| Moreton Bay College does a great student experiment on this topic. | Some basil are healthy, some look dead. |
The effect of different concentrations of hormones on the growth of tissue cultured plants
This student experiment follows on from the one above. Some Moreton Bay College students looked at the effect of hormone powder and they used impatiens cuttings and a commercially available rooting powder. Although impatiens is a weed, it is great for cuttings.
The effect of leaf vs root application of water to a plant
I must thank Yr 12 student James Hunter from Faith Lutheran College, Plainlands, Queensland (between West Ipswich and Toowoomba) for providing notes about his Biology student experiment. He lives in a prime agricultural area and was concerned about the effect of salinity on crops. He made the point that one-quarter of the arable land in Australia is affected by salinity; predominantly dryland salinity (caused by the removal of deep-rooted trees and shrubs and their replacement with crops that do not use as much water), or irrigation salinity (caused by heavily drawing on the water table, bringing water to the surface that contains high level of sodium chloride and other salts).
Irrespective of the cause of the salinity, salt, he said, is left in the soil, contaminating it for future crops. He investigated the effect of various concentrations of sodium chloride in water on two methods of application: "foliar & root" (sprinkler systems) and "direct root" application (drip irrigation system) on a young Sweet Basil crop. That is, he had two manipulated variables (the continuous variable - salt concentration) and a categorical variable - the method of application (either sprinkler or drip).
Some words from his abstract will give you a flavour of his student experiment:
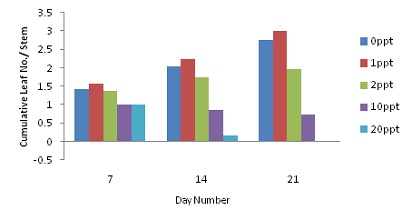
"This investigation studied the effects of foliar & root versus direct root application with saline water on young Sweet Basil crops. Levels were 0ppt (parts per thousand, or g/L), 1ppt, 2ppt, 10ppt or 20ppt water. All hypotheses were supported; as salinity increased past 0ppt, harvest dropped 0-100%. Also, direct root application tests performed 11-17% better than their respective foliar & root application tests due to the roots more advanced restrictive mechanisms. This report suggests using drip irrigation and a minimised use of sprinkler systems as exposure with saline water on leaves seriously damages crops. Also, water brought up by heavy irrigation can be highly dangerous."
 |
 |
| Day 14 - 'foliar & root' application on left, direct application on right, in Latin square formation. The randomised Latin square arrangement is used to minimise bias due to variation in light intensity. | Day 21 - Side photo of 'foliar & root' application in rows according to the NaCl concentration given, 0g/L at the right, then in ascending order to 20g/L at the left. |
 |
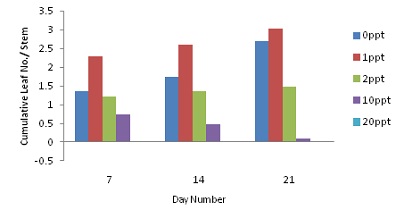 |
| Cumulative Harvestable Leaf Number per Stem for Direct Root Application of NaCl Solution | Cumulative Harvestable Leaf Number per Stem for Foliar & Root Application of NaCl Solution |
NOTE ABOUT THE ARRANGEMENT OF THE PLANTS
In a typical "factors affecting plant growth" experiment students generally make up pots of seedlings and give them different levels of treatment, and each level replicated twice (duplicate) or three (triplicate) times. For example, a student may want to test the effect of five different levels of salinity (as the treatment) on sweet peas and try each one in triplicate (the replicates). Imagine the concentrations of salt in the water (in mg/L) are 0, 10, 20, 30, 40 and 50. So a total of 15 pots (5 treatments x 3 replications) of plants are required. These could be set out as in the diagram below and the different concentrations of salty water added carefully to each pot.
Replicates |
||||
Treatments |
Concentration (mg/L) |
Replicate A |
Replicate B |
Replicate C |
1 |
0 (control) |
1a |
1b |
1c |
2 |
10 |
2a |
2b |
2c |
3 |
20 |
3a |
3b |
3c |
4 |
30 |
4a |
4b |
4c |
5 |
40 |
5a |
5b |
5c |
However, nuisance factors can spoil the experiment. For example, the outer pots could get more breeze or light, or the ones facing north could get more sunlight, and the ones in the centre could get more water when being sprinkled. The way to avoid these nuisance factors is to use a Latin Square (for equal numbers of treatments and replicates) or a Latin Rectangle (when the number of treatments is more or less than the number of replicates).
A Latin Square design is a method of placing treatments in a randomised pattern within a block. Treatments appear once in each row and column. Replicates are also included in this design. Figure 2 below shows one of the many Latin Rectangle arrangements for a 5 x 3 array.
| 1a | 1b | 1c | 1 | 2 | 5 | |
| 2a | 2b | 2c | 2 | 4 | 1 | |
| 3a | 3b | 3c | 3 | 1 | 2 | |
| 4a | 4b | 4c | 4 | 5 | 3 | |
| 5a | 5b | 5c | 5 | 3 | 4 |
Fig. 1. Simple arrangement of samples that will not minimize nuisance factors. |
Fig. 2. Latin Rectangle - randomised arrangement of samples to minimize nuisance factors |
Comment from Dr Mel Perkins, Sophia College, Plainland, Qld):
Such differences (above) have the potential to be so great as to mask any treatment-related responses. A typical way of dealing with this issue is to use a randomised complete block design (where each block represents a level of the prevailing gradient, e.g. low, medium or high light intensity) and statistically analyse the data accordingly so that variation due to the 'block effect' is separated from the 'treatment effect'. Plants don't need to be moved during the trial, saving a lot of work! It all hinges on having at least one replicate of each treatment randomly positioned within each block. It also requires knowledge of statistical analysis at a level which I think may go beyond the scope of high school science.
Simpler idea: If there are enough plants available, it is also a good idea to surround the experimental plants with buffer plants not included in the data analysis to minimise 'edge effects' (i.e., those extremes of light, temperature and desiccation typically encountered by plants on the edge of the trial plot).
Effect of temperature and chemicals on a beetroot membrane
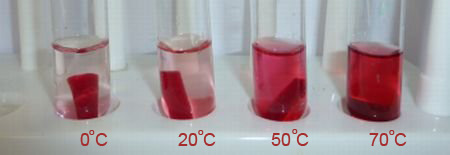
For centuries waterways have been used to dispose of household and industrial wastes. Only in about the last 150 years have concerns been raised about the environmental changes this could cause. In about the last 50 years people have carried out detailed research to find out the effects on living things of adding hot water (from industrial cooling systems) and chemical wastes to waterways. Many of these studies have been from an ecological perspective (looking at the changes in the species that are found in an area) or from a health perspective. (Is it safe to swim in the water or eat fish caught there?) It is not possible to observe membranes directly, so this investigation is an indirect study of the effects of different substances and treatments on living beetroot cells.
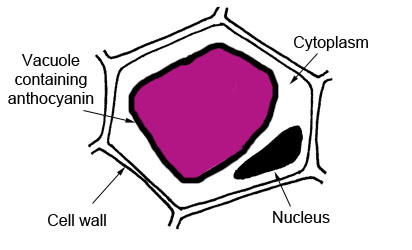
Here's a suggestion from Steve Mead of Browns Plains SHS, Brisbane. It is a simple method which can be adapted to form the basis of a student experiment (most likely a Yr 11 experiment). Beetroot cells have been chosen for this activity because each beetroot cell has a large central vacuole bounded by a membrane (see figure below). Contained in the vacuole is the red pigment anthocyanin, which gives the beetroot its typical colour. The whole beetroot cell is also surrounded by the cell membrane. If the two membranes remain intact the anthocyanin cannot escape into the surrounding environment. If the membranes are stressed or damaged, the red colour can leak out. The cell wall surrounding plant cells provides a structure to the plant. It does not have a role in controlling the movement of substances into and out of cells.
If the intensity of the colour is your dependent variable, you could make the temperature, or the concentration of various chemicals (eg alcohol) the manipulated variables. If you have a spectrophotometer the λmax = 535 nm. Click here to see an outline of the method. For a copy of the Browns Plains Year 11 Beetroot student experiment task sheet click here.
- What is the maximum temperature a cell can sustain before lysis occurs? (Beetroot)
- How does alteration of temperature impact on the structures of a cell? (Beetroot with microscopes or onion)
Salt damage on a beetroot membrane: effect on osmosis
This suggestion follows on from the one above - and involves spectrophotometric analysis of beetroot. It looks at the osmosis in cells damaged by high salt concentration. It comes from Biology teacher Belinda Coombe from Ryan Catholic College, Townsville.
The vacuole of beetroot plants contains a red pigment, betacyanin, as well as water. Betacyanin will only be found in the vacuole of healthy cells. However, if this membrane becomes damaged, the red pigment will leak out into the surrounding area and indicate the death of the cell. The intensity of the red colour is proportional to the amount of cellular damage. While some salt is essential for plant growth, too much can kill plants as water moves out of the cell through the process of osmosis. A significant reduction in a plant cell's water content causes osmotic stress which affects membrane integrity.
It can be downloaded here: Biological membrane prac (salt, beetroot).
Effect of surface area on a beetroot membrane osmosis
Here's a further investigation of beetroot. A student from Ryan Catholic College (Townsville) wrote: "In this experiment I aim to find out the relationship between the leakage of red pigment from a beetroot cell and the surface area. To do this successfully I will need to alter the surface area of the beetroot cells accurately and then measure if any and how much dye is let out. I can hopefully then look at my results and then find a relationship between the two factors and be able to explain exactly why any changes took place." Some suggested variables: Variables: temperature, time, pH (but you'd need to justify why these may have an effect; it's no good just doing trial-and-error.
Biology teacher Belinda Coombe has provided some additional notes if you want to develop this further. They can be downloaded here: Effect of Surface Area on Beetroot diffusion.
How Size and Shape affects diffusion of ions in agar jelly - a model for cell kinetics
This suggestion comes from Belinda Coombe (Ryan Catholic College). She sees it as the basis for a good student experiment.
All cells must exchange substances with their environment. This occurs through the cell membrane by the process of diffusion, osmosis or active transport. The larger a cell grows, the more exchanging of substances is required. However, this process can be limited by the surface area (ie amount of membrane) that the cell has, relative to the volume of the cell.
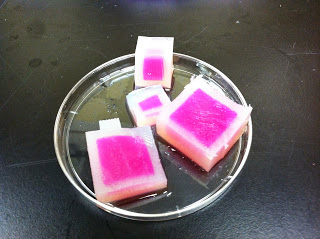 |
| The acid in the petri dish caused the phenolphalein indicator in the agar to go colourless. The smaller the block the greater the percentage volume affected. |
In this activity, blocks of agar jelly will be used to simulate different sizes and shapes of cells (or simple organisms). The jelly is a pink colour due to the presence of a base, sodium hydroxide (NaOH), and phenolphthalein indicator. The indicator is pink in a basic solution, but colourless in a neutral or acidic solution. When the blocks are placed in an acid solution, the acid diffuses into the jelly, causing it to change from pink to colourless. The time taken for a block to completely lose the pink colour is a measure of the rate of diffusion of acid into the jelly. You can download her tasksheet here: Size & Shape Diffusion Rate jelly prac.
Functioning Membranes - diffusion, osmosis, turgidity & plasmolysis investigations
If you are looking for some experiments that might form a basis of a good Year 11 student experiment, then this collection provided by Belinda Coombe of Ryan Catholic College may be useful. Download them here: Functioning Membranes Experiments.
She says: "The attached experiments are just 'starter'. If you take the basic idea and then alter a different variable, include more accurate changes in dilutions etc. Note however in the document - Function Membranes Experiment A - diffusion, we don't do any more due to potassium permangante, Exp 2.11 I have found the potatoes are not very successful, however the grapes work beautifully and you could always modify this experiment to weigh the grapes at the beginning and the end of the experiment. The beetroot one works well as well if you have a colorimeter or spectrophotometer - again students can vary the type or concentration of the solution. (varying the concentration of one solution tends to be better as then they have continuous data)."
Egg Membrane osmosis - everyone's favourite
Here's a terrific student experiment suggested by Kim Murray, Biology Teacher, Tannum Sands State High School. She says "The egg experiment works perfectly, and is one of my all-time favourite experiments - and the students love it! We run it over 3 lessons. The experiment is absolutely brilliant for boosting students’ understanding of these topics. It is fantastic and could make a terrific student experiment."
Under the hard outer shell of a chicken egg is a semipermeable membrane that allows air and moisture to pass through. Because water molecules can move into and out of the egg but larger molecules cannot, the semipermeable egg membrane allows for an exploration of the concepts of diffusion and osmosis. Osmosis is the movement of a solvent, such as water, through a semipermeable membrane into a solution of higher solute concentration that tends to equalize the concentrations of solute on the two sides of the membrane. The process of removing the outer shell while leaving the underlying membrane intact presents an additional opportunity for observations, as an acid-base reaction occurs when you make the "naked" eggs for the osmosis experiment. You can download Kim's student tasksheet here: Egg Osmosis Experiment (student); or the notes for the teacher Egg Osmosis Experiment (teacher's notes).
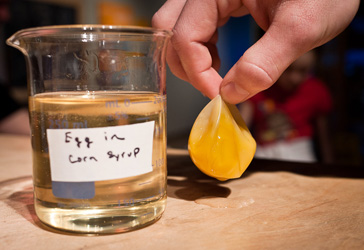 |
| You can tell which way the water moved through the egg membrane when it was placed in a sugar solution. |
Belinda Coombe says of the egg experiment: "I have also had students in the past use eggs and dissolve the shell first in vinegar, then carefully rub the shell off, they are left with the raw egg in its inner membrane, of which they then weighed the egg and placed in solutions and then weighed again after a period of time (we did lose lots of eggs in the process, but was a neat idea of using an actual membrane)."
For all of these diffusion/osmosis experiments Belinda warns: "Students need to be aware of if they are looking at diffusion or osmosis - this is dependent on the type of solution they are using. There are also further complicating factors such as if the solution is isotonic/hypertonic/hypotonic as this will change the type of graph they are reporting. Some good biology to explain there in the discussion."
However, another teacher warned: "We used to do osmosis/diffusion in the past but I learnt very quickly that unless you own some pretty powerful optical technology it may become an indirect evidence gathering exercise. Yes, you could with an egg after you dunk it in various salt solutions or distilled water. Also you could do something similar with various vegetable matter but the students won’t be actually observing the membrane in action so here you need to make a judgement call on the value of the exercise for the students. My past students found the exercise quite 'nebulous' and lacking 'tangible' outcomes."
Starch and glucose osmosis through dialysis tubing
Here's another suggestion from Kim Murray, Biology Teacher, Tannum Sands State High School. This suggestion is about osmosis using dialysis tubing. She said: "The dialysis tubing one works very well, and could be adapted using different solutions and concentrations.
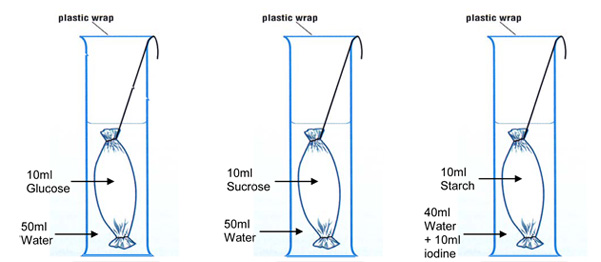 |
| The cell membrane determines what substances can diffuse into a cell. This characteristic of a cell membrane is called permeability. Many cells are selectively permeable - some substances can pass through the membrane but others cannot. Dialysis tubing is an artificial semi-permeable membrane with similar properties to the cell membrane. |
Download Kim's notes here: Diffusion & Osmosis Experiment using Dialysis Tubing. This experiment is also included in Belinda Coombe's document (Functioning Membranes Experiments) shown above. Belinda says: "We have used the dialysis tubing and then you can vary the type of solution/concentration that you put either outside the bag or inside the bag. There is a change in mass over time either into or out of the bag. This is the "osmosis in model cell" prac at the end of the Functioning Membrane document) It gives nice quantitative results.
Banana ripening kinetics - a great student experiment
When you pick fruit of a tree or vine it remains alive even though it is separated from its parent. They can't get water or nutrients from the parent so they have to use their own stored chemicals to continue. Bananas are like this. Mature green bananas are full of starch, but when you pick them they begin to ripen: their average starch content just before ripening reaches 25% and drops over a few days of ripening to less than 1%. But little is known about the mechanism involved.
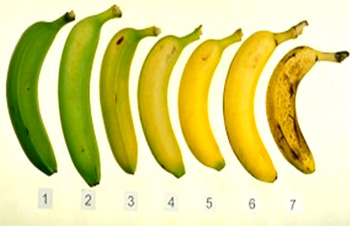 |
Bananas ripening over 7 days. |
It seems that the hormone ethylene triggers the production of enzymes. For example, the α(1→4) bonds of starch may be hydrolyzed by amylases (and glucosidases) or broken by starch phosphorylases. It has been observed that sucrose starts to accumulate first, before glucose and fructose, and parallel to starch disappearance. See N. Terra et al, 1983. "Starch-Sugar Transformation during banana ripening". Journal of Food Science, V48(4) p1097-1100.
This suggests a great student experiment. The question can be asked "What conditions affect the kinetics of banana ripening?" The obvious one is temperature, but an intriguing one is the presence of ethylene (ethene). This gas is produced as bananas begin to ripen so it would be instructive to compare bananas ripening in a plastic bag where the ethylene is trapped in with the fruit, versus ripening in a breeze where the ethylene is blown away. I've used a little fan out of a computer. That's all you need.
What would you measure as an index of ripening? Some books suggest iodine but that may be too inaccurate for a Biology student experiment. I suggest measuring the concentration of glucose. There are a couple of methods of measuring this but the two main ones would have to be: (a) using glucose test strips either by comparison against colour standards, or by use of a glucometer as used in diabetes monitoring; (b) if you also do Chemistry then a titration could be the way to go - using either using Benedict's solution, or an iodine/thiosulfate titration (download).
Diazotroph bacteria as a cereal crop growth promoter
All legumes used in agriculture can use atmospheric nitrogen after it is 'fixed' inside nodules on their roots by a soil bacterium, Rhizobium. The rhizobia receive growth substances from the legume, and the legume receives nitrogen compounds for its growth from the rhizobia. When high numbers of the appropriate rhizobia are not present in the soil, they must be introduced by adding them to the seed at sowing, by a process called inoculation. But can you inoculate non-legume plants with the bacterium?
The winning entry in the world-wide Google 2014 Science Fair Competition investigated this idea. The three girls who won the prize were Ciara Judge (16), Sophie Healy-Thow (17), and Emer Hickey (16) from Kinsale Community School in Cork, Ireland. The students knew that Rhizobia nodules were only found on certain leguminous plants such as peas and beans. But the girls wondered: why wouldn't these bacteria be beneficial to other species - specifically grains like barley and oats, which are integral to our food supply.
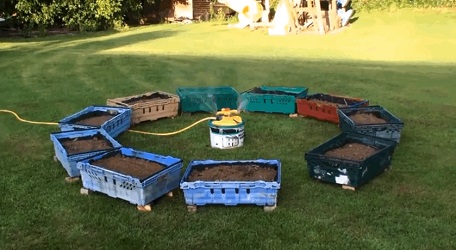 |
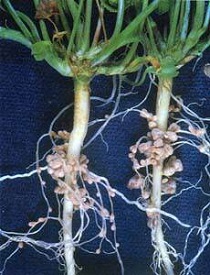 |
| The backyard watering set-up used by Ciara, Sophie and Emer from Kinsale Community School in Cork, Ireland. | Nodules on white clover plants. Note the large nodules are close to the crown of the plant. NSW-DPI photo. |
Over 11 months, the students tested more than 10,000 seeds, and recorded more than 120,000 individual measurements. When they were finished, they discovered that by infusing their seeds with rhizobia bacteria, the plants germinated in half the amount of time compared to seeds without rhizobia. Moreover, they measured that the mass of the plants increased by as much as 70 per cent. This would be a great student experiment particularly as it could be done in a shorter time and lots of variables to measure control. For more info see http://www.businessinsider.com/google-science-fair-winners-crop-bacteria-2014-9
Allopathy in the germination of seeds
Allelopathy is a biological phenomenon by which an organism produces one or more biochemicals that influence the growth, survival, and reproduction of other organisms. These biochemicals are known as allelochemicals and can have beneficial (positive allelopathy) or detrimental (negative allelopathy) effects on the target organisms. The possible application of allelopathy in agriculture is the subject of much research. Current research is focused on the effects of weeds on crops, crops on weeds, and crops on crops. This research furthers the possibility of using allelochemicals as growth regulators and natural herbicides, to promote sustainable agriculture.
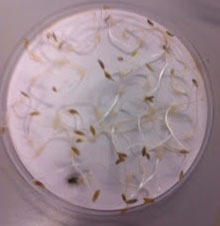
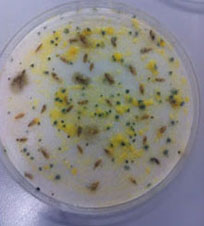
One student, Melissa, said: "We did and experiment in class to see the effect living plants may have on other plants that may be present nearby. This is known as allelopathy. Secondary metabolites cause these allelopathic effects.The most commonly known plant to exhibit this is the black walnut tree. Where a black walnut tree is present, most other plants cannot grow.Walnut trees produce a compund called Juglone, which stops other plants growing. In this experiment we tested the allelopathic effects of walnuts, oranges and lemons on lettuce seeds (Lactuca sativa). The aim of the experiment is to establish if the listed plants inhibit the germination of lettuce seeds and if they effect seedling growth."
 |
 |
 |
Control - 95% of the lettuce seeds germinated. (Melissa, 2014) |
With orange peel - not so good. |
With lemon, just as bad as orange. |
Here's a student experiment done by Nia Tilley's students at The Kooralbyn International School near Brisbane. She said:
The students did a study of the local weeds and noted lantana was very prevalent. They were then prompted by me to ask why and this led them to the reported allopathic chemicals in lantana. Students tested the effect of lantana on the germination and growth of selected plants, with the lantana affecting germination to some extent - it slowed it down but they eventually all germinated and then affecting growth very significantly. Some groups compared the effect of different parts of the plant (flowers, roots, leaves), others made tea from the leaves using hot and cold water as well as using the leaf mushed up. We trialled a few seeds first. Barley gave the most consistent germination. I also tried alfalfa at home and it worked well. Seeds were germinated in an incubator simply to speed up the process and because it was done in winter. Students placed 10 seeds in each petri dish. Each dish was lined with two pieces of filter paper. That was recommended by someone in this group who had done a lot of this type of work in a lab. They when watered them with 4 mL of liquid - water or lantana tea. Where mushed up lantana was used, it was placed under the paper and as little water as possible was used simply to make a mush. The amount of water added was then reduced slightly to accommodate for the water in the mush. Students checked seeds daily for germination. Once the seeds germinated they were all placed on a window sill to allow growth. Growth was measured by measuring the length of the leaf about 1 week after seeds were removed from the incubator. I think it would be really interesting to extract the actual chemicals from the plant. One problem I did find in the write up was that some students did not discuss the effect on biodiversity as much as I would have liked. |
This should be considered a good starting point. There is room for some good quantitative (numerical) testing. I would suggest that a number of dilutions of the alleopathic solution be made to see if there is a correlation between concentration and percent germination. You could also ask "what is the minimum concentration that will show an alleopathic effect?" I know it will be hard to establish a starting concnetration but it could be expressed as "g/mL" such that if 5 grams of lantana leaves were macerated with 10 mL water the concentration would be 0.5g/mL (or 50 g/L). Then you could do serial dilutions of this solution. Perhaps you could centrifuge the macerate, or filter it, so that you have a clear solution to start with. I wish I was doing it.
The symbiotic relationships between clams and turtle weed on Heron Island.
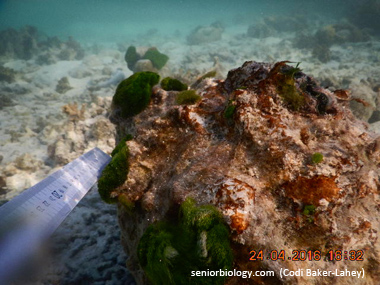
Heron Island is on the southern end of the Great Barrier Reef, Queensland, Australia. It seems likely that if turtle weed growth is determined at selected points along the reef flat on Heron Island then greatest growth would occur around largest clam due to the larger amount of nitrogenous wastes.
I am grateful to Year 12 Biology student Codi Baker-Lahey from St Andrew's Anglican College, Sunshine Coast, Queenlsand for her photos from her student experiment on turtle weed and clam symbiosis there. Please see photos below. I asked her if she saw any evidence of coral bleaching so far south and she said "I didn't see any coral bleaching which is a good sign".
 |
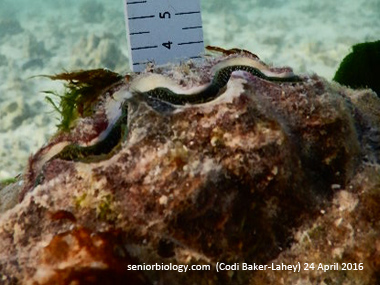 |
| 1) Turtle weed clumps were found within a 1m radius of the clam. (Codi Baker-Lahey, 24 April 2016) | 2) The clam height was measured using a 1m ruler. (Codi Baker-Lahey, 24 April 2016) |
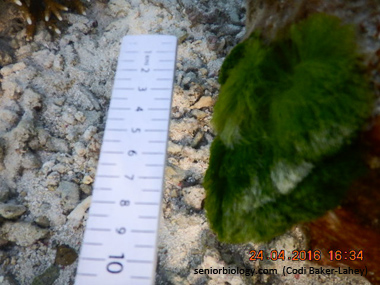 |
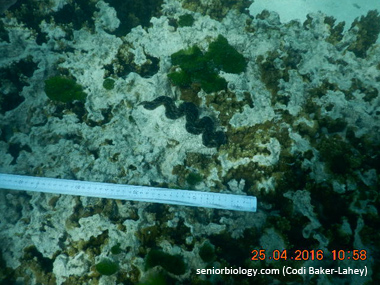 |
| 3) The size of the turtle weed was measured with a 1m ruler. (Codi Baker-Lahey, 24 April 2016) | 4) In deeper water, data was collected by diving down below the surface and recording with a plastic slate and pencil. (Codi Baker-Lahey, 24 April 2016) |
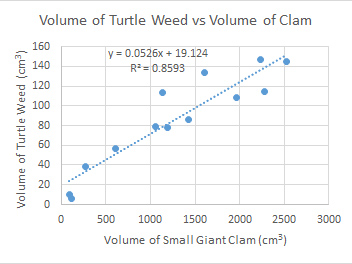 |
| Cody's data shows a linear relationship between the volume of the clam and the volume of the turtle weed. |
In conclusion Cody said: "The hypothesis proposed was that: the largest Turtle weed (Chlorodesmis fastigiata) growth (as recorded by length, width and height measurements to find volume) will occur around the largest Small Giant Clams (Tridacna maxima) (as recorded by length, width and height measurements to find volume) because of the nitrogenous waste produced by the Small Giant Clams was supported by the data collected. It was predicted to be a direct relationship between the volume of Small Giant Clams and Turtle weed and a reasonably directly relationship was established. This relationship is modelled by the equation y = 0.0526x + 19.124 with an R2 value of 0.8519."
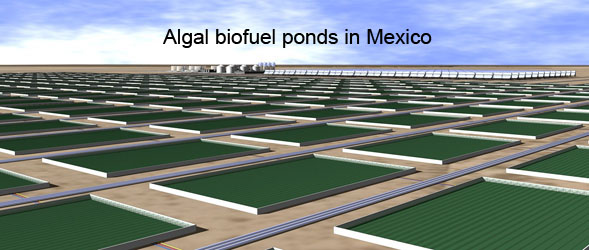
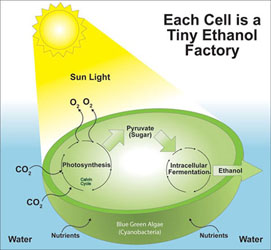
Ethanol biofuel from green algae
Ethanol is used as an alternative fuel source and as a petrol additive. It burns cleaner than petrol and diesel and can be produced from (renewable) algae by fermentation rather than being extracted from non-renewable sources such as oil. Algae grow very simply, needing only water, sunlight and carbon dioxide to thrive. After the algae is harvested and treated to release carbohydrates, yeast is added to begin fermentation, which creates ethanol in a similar way that ethanol is produced in wine or beer. One of the major benefits of using algae to produce ethanol is that algae can be harvested day after day, unlike competing sources, such as corn and soybeans.
Algae can also nearly double in quantity overnight, if the conditions are perfect (see student experiment suggestion below). To achieve perfect growing conditions, producers must ensure that algae do not get too much direct sunlight, which can kill them, and that the growing environment is moist, has a constant warm temperature and has clean water with balanced salinity and the optimum pH. A good (but difficult) student experiment would to make ethanol by the fermentation of algae as it can be done at home or in the lab.
There are many variables to consider in maximizing the amount of ethanol produced: type of algae, conditions (temp, sunlight, pH, water salinity), time before harvest (= money), type of yeast and added nutrients. How do you measure the amount of ethanol produced by distillation (density, volume, mass)? Choose one or two (at the most) variables to manipulate and control the rest. Plenty of websites available (note: biodiesel fuel from algal oil is a different process and probably too hard for senior biology). Students may find that a lot of time has to be spent understanding algae fermentation and this may make this student experiment too time-consuming. Nevertheless a Australian Government report on these variables can be downloaded here: Biohydrocarbons from Algae.
 |
 |
Growth of algae
The algae present in lakes depends on whether the water is fresh or salty and whether it is poor in nutrients or rich in nutrients. There are two approaches to doing an student experiment on this topic. One (involving manipulating variables) is to grow your own and and measure density, volume and mass (or whatever you choose as an index of growth) at different stages under different conditions. With those results, you can talk about the optimal growing conditions for a real-life situation such as a biodiesel and ethanol biofuel farm (an important part of the "Evaluating Biological Issues" criteria). For some good background information the Australian Government report on these variables can be downloaded here: Biohydrocarbons from Algae.
To help you get started, here are a few suggestions about factors affecting growth:
Algae type: two algae often used are the slow-growing filamentous algae Spirulina sp, or the fast-growing single-celled Chlorella sp.
Light: algae can grow at higher light intensities than normal daylight (even in Northern Australia) but can take up to 4 weeks to acclimatise to high light. The degree of mixing, and the length/depth of a pond affects how much light get to the cells.
Temperature: Each species has an optimum temperature, but they can tolerate up to 15°C lower than this. However, sometimes just 2-4°C higher than optimum can be toxic.
Oxygen: oxygen is produced by photosynthesis but high levels are a major inhibitor.
Carbon: CO2 is essential for algaal growth but some species can use the hydrogen carbonate ion HCO3-. None, however, can use the carbonate ion CO32-. These three species all exist in equilibrium and the ratios are affected by pH.
pH: Algae can tolerate pH up to 11 but the
CO2 availability is affected at high pH. Generally, all is okay with pH<8 although the higer the pH the better it is at killing pathogens (especially if you are growing algae commercially in wastewater, such as from a pig farm).
Nitrogen: nitrogen is abundant in wastewater but if you are adding it as a variable then you can use nitrate NO3-, urea, or ammonium ion NH4+ as sources. Algae prefers the ammonium form, although high ammonium levels are detrimental. Please note: ammonium ion NH4+ and ammonia NH3 are different species and should not be confused. At high pHs, the equilibrium shifts towards the NH3 form which is quite toxic. But ammonium levels over 200mg/L are detrimental to some algal species. The effect of ammonium/ammonia species on algae is little understood so here's your chance of fame.
Phosphorus: limiting P reduces growth whereas an excessive P concentration is not a problem. However, high P levels are toxic. Note that at high pHs, phosphorus can precipitate as phosphates and not available for growth.
Trace elements: S, Fe, Mg are needed but are not toxic in the amounts found in normal wastewater. High levels may be though.
Growth of algae - investigating natural (concominant) variation
Further to the algae suggestions above: you could rely on natural variation rather than manipulating the variables yourself. This is called 'natural variation' or 'concominant variation' where you rely on nature making the changes in your independant variable. You might be to examine the algal flora of various lakes or rivers and to look at the growth at different depths, or at different times of the year etc. You can grow cultures of algae on glass slides tied to floats at different depths as shown in the diagram. Some people like to use more 'natural' substrates like autoclaved oyster shells etc. but these are harder to examine. Think clearly about the comparisons you want to make; is it between depths in the one lake; at similar depths in different lakes; between areas with different flow rates; upstream and downstream from effluent entry; between different times of the year in the same lake? It is better to do one or two comparisons well, than lots badly.
Click Project 2-1 for Prof. Jennifer McComb's resource sheet. Note again: this second type of student experiment does not involve manipulating variables (unlike the first suggestion); instead it relies on natural variation. It is sometimes called a "correlational study".
 |
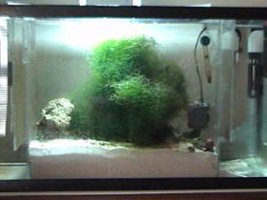 |
Submarine forests of kelp, a large brown alga (Macrocysti) |
Marine aquarium tank being used for algae experiments. |
Smart waste solutions with algae
Want a real challenge for your student experiment and want to do something good for the world? Here's an idea. Every year, huge blankets of algae - some larger than Sydney Harbour - spread along the Shandong coast between Shanghai and Beijing in China - the by-products of fish farms. Although not toxic, the blooms block sunlight and suffocate marine life. It costs the Chinese government around $250 million every year to clear its seas using chemicals to break down the blooms.
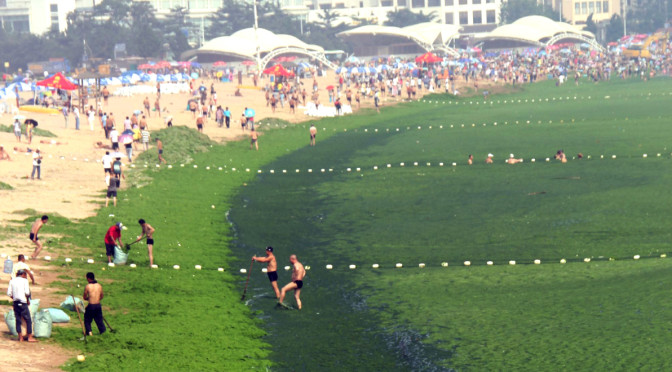 |
A huge blanket of algae spread along the Shandong coast between Shanghai and Beijing in China. |
The Chinese asked a Queensland company - MBD Energy - to develop a technique to harvest the Shandong algae and to turn it into biochar – a soil conditioner – which could fertilise the ground in the region naturally. The process would reduce use of synthetic fertilisers, cut costs and reduce water pollution. MBD Energy has a research station at Pacific Reef Fisheries, Ayr, in Queensland, where scientists are using biological processes to clean up wastewater from prawn farms. They draw on the expertise of James Cook University (JCU) algae researchers, Associate Professor Kirsten Heimann and Professor Rocky de Nys.
In the process, the system produces tonnes of algal oils, nutrients for animal feed and other valuable by-products, including plastics and potential new pharmaceuticals. The remediation of industrial wastewater alone is a multi-billion dollar industry and market. The researchers are more optimistic than ever about the role algae will play in helping to meet growing demand for energy, food and clean water.
The question is "how do you turn this into a viable Biology student experiment?" You could look at one of their papers to see if there are some possible ideas. Start with Professor de Nys's article at https://research.jcu.edu.au/portfolio/rocky.denys/ particularly the one titled "Algal biochar enhances the re-vegetation of stockpiled mine soils with native grass".
Growth of algae
A good experiment suggested by Kathryn Gardner for a Biology student experiment is on the rate of photosynthesis in algae. She says that "all of these experiments have worked well for us in the past". The link takes you to some experiments on Algal Jellyballs that was produced by Science and Plants for Schools (SAPS).
Green algae photosynthesise in a way similar to that seen in higher plants. In this practical, students use algae to look at the rate of photosynthesis. Since algae are tiny and are difficult to work with directly in the water, the first part of the practical involves 'immobilising' the algae as algal balls. This effectively traps large numbers of algal cells in 'jelly like' balls made of sodium alginate. Sodium alginate is not harmful to the algae, and they will continue to photosynthesise once immobilised.
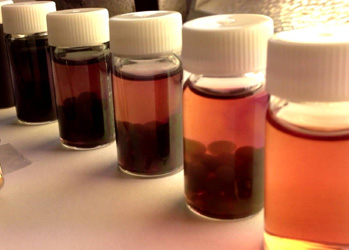 |
This photo of an algal ball experiment has been provided by Sara Leith. Have a look at: https://www.youtube.com/watch?v=0Yt-uAf2By8 |
Microalgae
Biology teacher Ivy Walsham has suggested independent variables worth considering for an student experiment using microalgae:
- effect of light intensity on growth of microalgae
- different coloured light on growth of microalgae
- effect of carbon dioxide
- effect of nutrients (change nitrate, phosphate etc)
- effect of micro-nutrients like vitamins.
She says "Culture the microalgae in test tubes and record the daily growth. You can use a haemocytometer for counting the microalgae. If you culture under ideal conditions for 10 days you will get a graph similar to bacterial growth (exponential graph).
The pure cultures of algae are available from CSIRO. You can maintain the algae for a long time in the laboratory by sub-culturing it in agar plates."
Effect of copper on the growth of algae
The last thing you want in your swimming pool is algae - the green plant that grows on the walls and bottom of the pool. There are several ways to control it: keeping the sanitizer (chlorine) levels correct helps but often a copper-based algicide (algae killer) is used. The copper ion (Cu2+) is a very effective algicide to both kill and prevent algae formation. Swimming pool companies say that about 0.03 to 1.0 mg/L (0.03 to 1.0ppm) of free copper ion must be present to be effective and safe.
The word "free" is used because "bound" copper (copper is tied up in an insoluble form) is not available to work as an as algicide. For non-biological systems (where no living plant or animal is present) a continuous level of 1.0 ppm is enough to assure effective algae control; more is superfluous and may damage surfaces and equipment. The toxicity of copper to algae has been the subject of a number of studies over the past 40 years because of its widespread use for the control of algae in natural waters. This suggests a good student experiment.
You could try growing algae in solutions with different copper ion concentrations from say 0 to 1 ppm. One problem you will have to sort out is how to measure the amount of algae in the samples. Perhaps it can be done using a spectrometer, or by measuring the depth at which you can just see a black cross appear/disappear (like in a simple nephelometer tube, or like the Secchi Disk method for turbidity in natural waters).
Safety note: copper is a heavy metal ion and is considered hazardous. It is important that you become aware of the risks. Care should be used when handling this product.
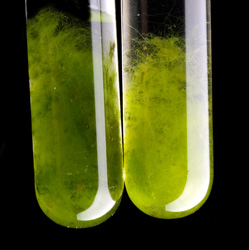 |
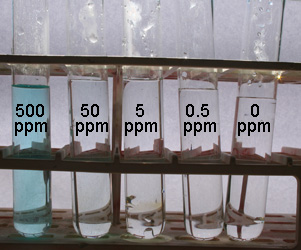 |
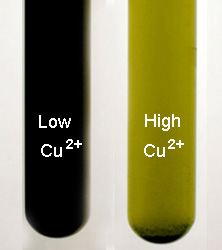 |
| Algae growing in nutrient (no copper). | Copper sulfate solutions are blue - but only at higher concentrations such as the 500 ppm of Cu2+ ions shown here. You can just see some blue at 50 ppm but not at lower amounts. In your experiment all solutions will be colourless. | In these test tubes, algae has grown faster in the left-hand tube than in the right. The problem is - how do you measure the amount? |
An interesting study by Drs Jenny Stauber and Mark Florence from CSIRO's, Division of Energy Chemistry, Lucas Heights Research Laboratories, Sydney, Australia found that copper ions depressed both cell division and photosynthesis in many species of algae notably the common freshwater green alga, "Chlorella" (Chlorella pyrenoidosa). They suggested that ionic copper toxicity may result from an intracellular reaction in which copper suppressed mitosis. In addition, they said that copper inhibits the enzyme catalase and reduces cell defence mechanisms. Reference: J. Stauber and T. Florence, 'Mechanism of toxicity of ionic copper and copper complexes to algae', Marine Biology 94, 511-519 (1987).
In their experiment they maintained Chlorella pyrenoidosa in MBL medium on a 12 hour light: 12 hour dark cycle (Philips 40 W fluorescent tube, white, 6500 K - see photo below) at 21ºC. They found that a Cu2+ concentration of 7.9 x 10⁻⁷M (5 x 10⁻⁵ g/L, equal to 0.05 mg/L or 0.05 ppm) gave a 50% reduction in growth. Click here to see what the MBL medium consists of (this may be too complicated for high school student experiment). One question you need to sort out is how to measure algae growth (perhaps measure the absorbance in a spectrometer). If you don't do Senior Chemistry you may need to brush up on your formulas for amounts and concentration.
The copper sulfate your school lab has is most probably copper sulfate pentahydrate (CuSO4.5H2O). It has a molar mass of 249.5 g/mol. Copper itself has a molar mass of 63.5 g/mol. Thus, to make a 1000 mg/L Cu2+ solution (1000 ppm) you would have to weigh out 1000 x 249.5 ÷ 63.5 g of CuSO4.5H2O per litre of distilled water (3.929 g/L). Make sure you use distilled water as tap water will go cloudy. You can then do serial dilutions (1:10) to reduce this to 100, 10, 1, 0.1 ppm Cu2+, and from there you can make the solutions you want.
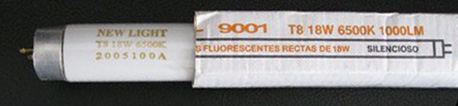 |
| This photo relates to the second-last paragraph above. A fluorescent tube (watch the spelling). The 6500K is an indication of the whiteness of the colour. It is said to be the "colour temperature" and is measured in the unit "kelvin" (K). It doesn't mean it reaches that temperature though (= 6227°C); it is just the colour given off by an object at that temperature. Temperatures over 5000K are called cool colors (blueish white), while lower color temperatures (2700-3000 K) are called warm colors (yellowish white through red). |
Effect of pH on the toxicity of copper algicide
Stauber and Florence (see above) found that at pHs below 7.0, the toxicity of copper is greatly enhanced. This suggests another student experiment whereby you prepare solutions of desired pH by diluting some 0.1 M hydrochloric acid (pH 1). A ten-fold dilution should increase the pH by 1 (approximately), so a 0.01M solution has a pH of 2 - check with a pH meter. To each of these add the right volume of a standard copper solution to end up with a known concentration of copper - say 1 ppm. You may have to read up on pH, strong acids and dilutions.
Effect of other metals on the toxicity of a copper algicide
Toxicity of ionic copper on algal growth is known to be reduced by trivalent (3+) metal ions in the growth medium, including those of Mn, Co, Al, Fe and Cr which form a layer of metal (III) hydroxide around the algal cell, adsorb (not absorb) copper and reduce its penetration into the cell. The degree of insolubility of the metal (III) hydroxide is related to its ability to protect against copper toxicity. That's another variable you could try. Probably best to choose one of two metals and try a few different concentrations (keep the Cu2+ concentration the same).
Effect of availability of copper on the toxicity of a copper algicide
When you look at algicides in a pool shop, they most likely will have two types of copper-based solutions for sale: a 5% CuSO4 solution (5 g CuSO4.5H2O/100mL) and one that is an organic complex of copper - usually called "chelated" copper (about 7% Cu). These copper complexes ( such as copper alkanolamine complex) are said to be more toxic to algae than ionic copper because both the metal and the ligand (organic part of the molecule) are introduced into the cell. They are also more resistant to changes in pH. For an student experiment you could compare the algicide ability of both forms at the same concentration of Cu2+, and compare them at different pHs.
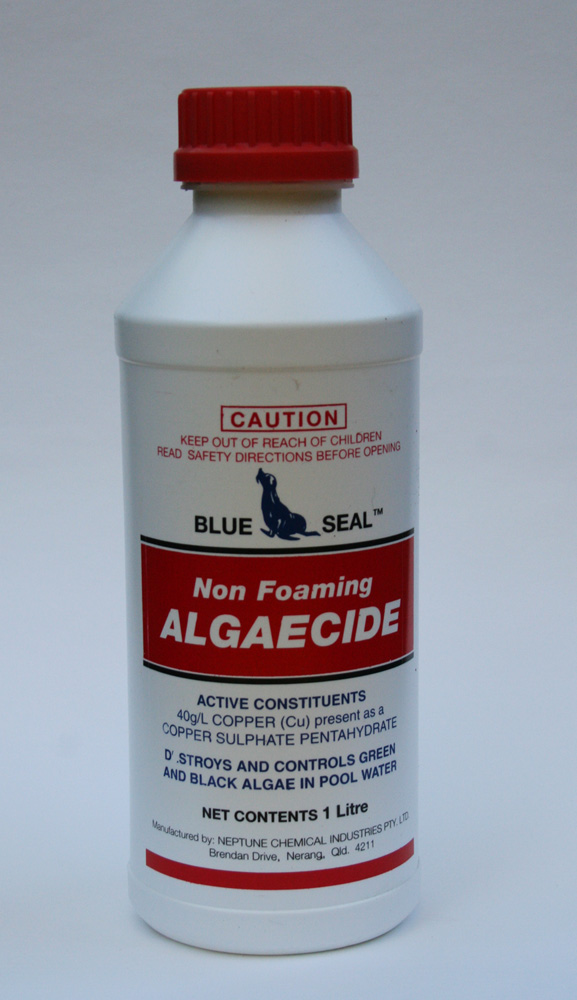 |
 |
 |
| Ionic copper (40g/L copper sulfate). Click image to see closeup of the label. Click here to see label on back of bottle. Price $25/L. | Chelated copper is a better algicide as it keeps working for several weeks whereas copper sulfate is only good for a day or so. Pool water usually contains a high concentration of carbonate ions, so the copper ions in CuSO4 will react quickly with the carbonate ions and form an insoluble precipitate of copper carbonate. | You can also get non-copper based algicides. The one above ($40) contains benzalkonium chloride a well-known disinfectant used in Dettol. Click image to see close up of label. |
Enhancing the growth of algae with copper micronutrient
In addition to being toxic at relatively high levels, copper is (surprisingly) also an essential micronutrient for algae at very low concentrations. However, the levels are in the order of parts per billion and probably outside the scope of a high school student experiment. Interesting research by Stanley Manahan and Michael Smith of the Department of Chemistry, University of Missouri-Columbia, USA, titled 'Copper Micronutrient Requirement for Algae' is reported in Environmental Science and Technology, Vol. 7, no. 9, September 1973, pp 829-833).
Liquid seaweed extracts
Scientific opinion on the beneficial effects of seaweed extracts on plants range from dismissal as "muck and magic" to cautious acceptance (Abetz, 1980). Unscientific opinion is often wildly enthusiastic and claims all sorts of wonderful effects. Liquid seaweed extracts are sold in garden shops under weedy names like Seasol, Marinure, Maxicrop, Algistim. Scientific analysis has shown that the beneficial effects are unlikely to be from the mineral nutrients in the extracts but possibly come from hormones or other organic substances included in the extract.
Claims are made that seaweed extracts affect plants in the following ways a) increase frost resistance, b) increase resistance to fungal disease, c) increase resistance to insect attack, d) result in higher yield, e) deeper root penetration, f) increased nutrient uptake, g) better shelf life of fruit and vegetables. A good student experiment might be to investigate these factors, however, it would not be possible for you to investigate a), b) or f) in an acceptable way but other features are open to experimentation. Alternatively, you might try something new like the effect on keeping qualities of cut flowers. Click Project 2-2 for Prof. Jennifer McComb's resource sheet.
 |
 |
| Marine phytoplankton are extremely tolerant to changes in salinity. The best algae growing conditions for most species is at a salinity level that is slightly lower than that of their native habitat. Salinities of 20-24 g/L have been found to be optimal. | Seasol Liquid seaweed extract. Said to be a "soil revitaliser, growth stimulant and plant tonic, not a fertiliser". |
Life cycle of mosses
Little is known about the relative importance and timing of the parts of the life cycle of most Australian mosses. The sort of details that are required are the times of spore discharge, growth of the protonema, leafy gametophyte production, sex organ production (archegonia and antheridia), fertilization, growth of sporophyte, relative importance of reproduction by spores or gemmae and tubers.
Decide how much time you want to spend in the four possible areas of activity - field observations, spore culture, cultivation of gametophytes, experimental investigation of spore and leafy gametophyte growth. Where are you going to get information on local temperatures, day length, rainfall etc. to relate to your life cycle observations? Click Project 3-1 for Prof. Jennifer McComb's resource sheet. Note: this student experiment does not involve manipulating variables; instead it relies on natural variation.
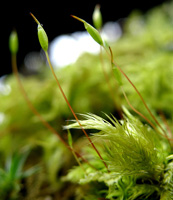 |
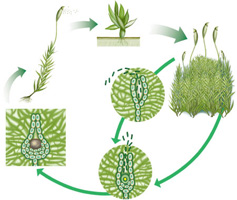 |
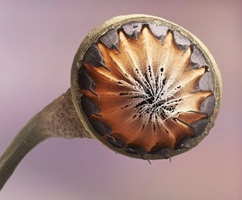 |
| The upper part of the moss capsule (sporangium) often specialized for gradual spore discharge. | The life cycle of moss begins with asexual reproduction. Leaf-like moss grow thin, brown stalk with capsules at the top. The capsules contain tiny spores instead of sex cells. Spores are the cells that can develop into a new individual without fertilization. | Moss spore capsule. Coloured scanning electron micrograph (SEM) of the mouth of a capsule (spore case) of a moss. Mosses reproduce by means of spores (small blue spheres) which are dispersed from the mouth of the capsule by the numerous rays (orange and brown) that snap open. |
Germination and growth of moss spore
s It is fairly simple to grow moss spores under sterile conditions. In time, leafy gametophyte may grow from the protonoma. You might like to try to grow spores of various Australian mosses about which little is known. Alternatively, you could pick one that is easy to grow like Funaria hygrometrica (Club Moss) and conduct experiments to determine what controls germination, growth, differentiation of leafy gametophytes etc. An student experiment such as this will depend on what time of the year you do it. Mature spore filled capsules are mostly available in the latter half of the year and ones collected in February, March often are hard to sterilize. Glasshouses may be a source of 'out of season' capsules. What will you look for as an early sign of leafy gametophyte development? How might you count the numbers of spores per capsule, per culture, or the number of leafy gametophytes that form? Click Project 3-2 for Prof. Jennifer McComb's resource sheet.
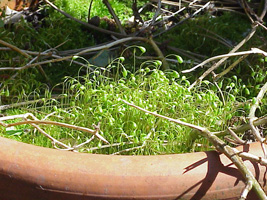 |
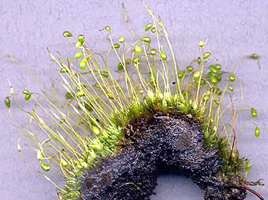 |
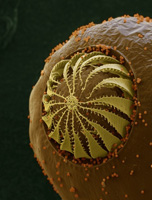 |
| Funaria hygrometrica (Club Moss) | Funaria hygrometrica (Club Moss) found growing on a fireheap. | Club Moss spore |
Bulbs that pull themselves down into the soil
Some plants have contractile roots that pull the bulb down into the soil. Oxalis (sour sob) does this, but the published work is on American species and it would be of interest to know how the local weed species (Oxalis pes caprae) behaves before designing eradication programmes. This suggests a possible student experiment. Are you going to use bulbs of one particular size or compare burial rate/final depth of bulbs of different size classes? How does the final burial depth and switch over from vertical to horizontal contractile roots compare with depth of bulbs in the field? Click Project 4-2 for Prof. Jennifer McComb's resource sheet.
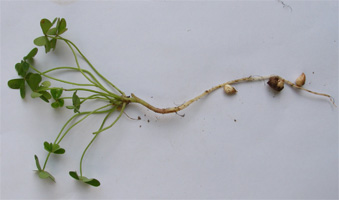 |
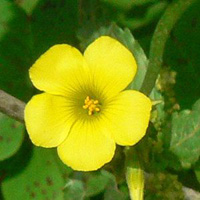 |
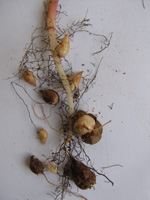 |
Oxalis pes-caprae is often called by the common name soursob due to its pleasant sour flavour. |
"Sour sob" is also a local weed - but is quite pretty. | Close up of its roots. |
Root responses to gravity
As you know roots grow downwards and if tipped sideways will curve over to point downwards again. This is called geotropism. There are lots of fairly conventional experiments you can do to find out which part of the root bends, if bending occurs if the roo tip is cut off, the relationship between the outward force and gravity etc. However for an student experiment you may wish to do something more difficult.
It is known that the first root that comes out of a seed (the radicle) is strongly geotropic. Lateral roots must be less so. Can you measure the strength of geotropism in a radicle and compare it with that seen in 1st order, 2nd order laterals? Is there any difference between plants that have a taproot compared to a fibrous root system? If you cut off the tip of the radicle when it is about 2 cm long is the strength of geotropism altered in the side roots if you measure it about a week later? How will you measure curvature? How are you going to measure "strength" of geotropism? How are you going to hold the seedlings vertical till you're ready to start the experiment? Click Project 4-3 for Prof. Jennifer McComb's resource sheet.
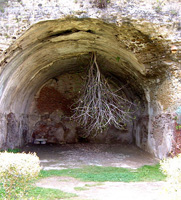 |
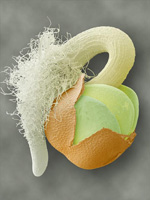 |
| Example of geotropism in the remains of a cellar of a roman villa in the Archeologic Park in Baia, Italy. | Coloured scanning electron micrograph (SEM) of a late stage in the germination of a plant seed. The radicle (white), the embryonic root, is growing downwards in a response to gravity. |
Root parasitism by the Christmas Tree
The West Australian Christmas tree Nuytsia floribunda is a "hemiparasite". Although it has green leaves and apparently normal roots it is unable to live unless it makes connections with the roots of other plants from which it sucks nourishment. The connections are called haustoria and a possible student experiment would be to discover what stimulates the Christmas tree roots to make haustoria. Other hemiparisites are found in Queensland and these may be suitable for this investigation. Trees are apparently not very selective as they have been known to latch hopefully onto underground electric cables. How will you select the place in the field to bury your objects? How will you find the stuff you bury in several months' time? Are you going to have one harvest or several? Think carefully about your experimental design so that you will distinguish between substance, shape in cross section and diameter of your test objects. Click Project 4-4 for Prof. Jennifer McComb's resource sheet.
 |
 |
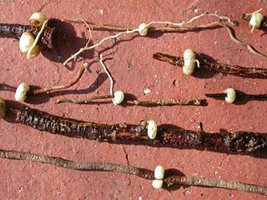 |
| The species is known locally as the Christmas Tree, displaying bright orange flowers during the Christmas season. | The Western Australian Christmas Tree is an important food source for wallabies and kangaroos. The habit of the species is a tree up to 10 m high, or as a shrub. | Plant roots with attached white Nuytsia haustoria. Photo by Christopher Taylor entomologist. |
Rooting of cuttings
Propagation of plants from cuttings is important in the horticultural industry and there is a continual search for compounds that will improve the success rate with rooting cuttings. Auxin hormones which induce root formation are available commercially. It has been found that commonly used fungicides may have a stimulatory effect or a depressing effect on root production when used along with the rooting powder.
For an student experiment you might like to examine the effect of these chemicals on some exotic and native plant species. For interaction experiments like these you have to be extra careful about your design. There may be several 'control' treatments necessary. How are you going to score rooting? Can you devise a quantitative scheme that will convert observations like 'poorly rooted' and 'many vigorous roots' to numerical values allowing a mean to be made of all cuttings for one treatment? Click Project 4-5 for Prof. Jennifer McComb's resource sheet.
 |
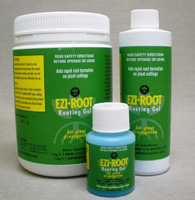 |
| Rooting hormone compounds are available in the form of a dry powder (above) or as a gel or liquid. | Ezi Root Gel is an Australian-made blend of IBA (indole-3-butyric acid) and NAA (naphthylacetic acid) hormones along with a wetter and fungicide. |
Tolerance to waterlogging Plants
vary in their ability to survive periods of waterlogging. Species differ, and within species some strains or cultivars are superior to others. Observe which plants have survived in waterlogged areas in your district, and those that are abundant on well drained sites. You could do an student experiment to show whether or not species found in waterlogged conditions can in fact survive waterlogging better than others. At what stage of growth are you going to flood the plants; to what depth? For how long? How are you going to measure recovery, growth, yield and so on. Remember, a plant has both above and below ground parts. How many harvests are you going to make? What other soil or water parameters might you measure during your experiment? Click Project 4-6 for Prof. Jennifer McComb's resource sheet.
 |
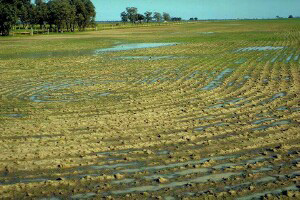 |
| Olive trees: even small periods of waterlogging or "wet feet" can predispose trees to root-rot and other disorders that affects tree growth and survival. | In high rainfall areas of Australia, waterlogging is the major constraint to soil health and crop yields particularly of many grain legume, oil-seed and cereal crops early in the growing season. Photo: S. E. Victoria. |
Effect of seawater and/or detergents on plant
s Plants that grow along the beach can tolerate the salty ocean spray that blows onto their leaves. They may however be severely damaged or killed if any detergent gets into the water. The question is what would happen to your local beach plants if the sea water was polluted with detergent? The beautiful Norfolk Island Pines around Sydney beaches like Bondi and Maroubra were killed as a result of the detergents in sewerage released in the ocean (see Pitman, MG, Dowden HGM & Humphreys, FR 1977, 'The outfall connection: the plight of our coastal trees', Australian Natural History, vol. 19, no. 3, pp. 74-8).
Plants that grow around river estuaries that go salty in summer could also be investigated. Having observed the effects of an experimental salty spray and which plants are most sensitive you might check out plants near your local ocean sewerage outlet. It is important to know how the sewerage is treated as different treatment methods reduce the amount of detergents that remain. Will you treat the plants with detergent in straight sea water or diluted sea water? How often will you treat? How will you mark the treated leaves, prevent spray drift, score the damage? What will be your control? Is there any way of measuring the salt the plants get in the field in addition to your experimental sprays? Click Project 4-7 for Prof. Jennifer McComb's resource sheet.
 |
 |
| Norfolk Island Pines along Bondi Beach, Sydney, at the southern hill. | Norfolk Island Pines at Port Macquarie, NSW |
Effect of coal seam gas water on plant
s Coal seam gas is an important energy resource in Queensland and production of this gas now makes up an increasing proportion of Queensland gas demand. Coal seam gas is natural gas - a mixture of predominantly methane and other hydrocarbon gas compounds. It is bonded (through geological and hydrological pressure) to microscopic surfaces (described as cleats or fractures) of the coal. It is effectively held (adsorbed) in the coal by burial pressure and water. Coal seam gas producers drill numerous wells into the coal seams below the surface to extract the gas.
The Queensland Government acknowledges that landholders face increasing pressure for access to their land for gas and other resources exploration and development. Water is a primary by-product of CSG development. The quality of the water ranges from potable to saline and may be rich in other constituents that make it unsuitable for many uses. The rapid expansion of the coal seam gas industry in the rich farming region of the Surat Basin (Darling Downs) may poses significant risks to agricultural production and water supplies where agricultural production in the Surat Basin is worth $1.5-2 billion. The coal seam gas industry is likely to drill up to 40 000 wells in Queensland by 2030, taking a minimum one hectare each of prime agricultural land each.
Yet many people believe that there are many unanswered questions about its broader impacts which have alarmed farmers who fear that their livelihoods and the country's food security may be put at risk. The water that comes out of the coal seams contains a lot of salt, something like five to eight tonnes per megalitre and up to 2.8 million tonnes of salt could be brought to the surface by coal seam gas mining to impact local prime farm soils. This seems like an ideal topic for an student experiment. You may like to find out what chemicals are in coal seam gas water and investigate their effect on the growth of plants (but don't even consider the BTEX carnicogens benzene, toluene, ethylbenzene and xylene).
 |
 |
| Surface water can be contaminated with the toxic chemicals used in the fraccing process, including the so-called BTEX group (benzene, toluene, ethylbenzene and xylene), as well as salt and methane. | Drilling for gas: Queensland's new coal seam gas industry is booming - but it is not without it's concerns. |
Movement of plant stems
The growing tip of a stem does not grow directly vertically but moves upwards in a helical path. The question is whether there is a difference in the magnitude of the movement (called circumnutation) in shrub plants and twining climbers. What environmental factors affect the movement e.g. will it continue in complete darkness? What happens if a piece of vertical fencing wire is placed in the path of a twining stem of leaf tendril? Darwin's method of examining circumnutation works well even though it is 100 years old! The idea is to mount a sheet of glass about 10 cm above the plants and to line up the apex and put a spot on the glass.
Doing this every couple of hours gives you a record like that in the diagram of the plant's movement. What do you think causes the movement of the tip? How will you be sure wind, drought etc. are not affecting your plants? How are you going to quantify the magnitude of the movement? How will you be sure that phototropism is not affecting your experiment? Can a given twining plant climb around supports of different sizes? What is the critical cylinder radius above which a plant is no longer able to twine? What is the effect of friction in the vine ability to grasp the pole? Similarly, what is the pressure generated by a plant on the pole? Click Project 4-9 for Prof. Jennifer McComb's resource sheet.
The figure below on the right (below) has been taken from "Mechanics of Climbing and Attachment in Twining Plants" by Alain Goriely and Sebastien Neukirch, Physical Review Letters 97, 184302 (2006) - click here to get an extract.
 |
 |
| A curling tendril | Circumnutation showing the continuous, almost helical, curling followed by the anchor that provides tension in the filament. |
Floral clocks
The timing of flowers opening and closing and of pollen shed is well known for European and horticultural plants. In fact Linnaeus in 1748 made a floral clock in his garden so that you could roughly tell the time of day by sstudent experimentng which flowers were out! Similar information is not available for most Australian wildflowers. Some species have flowers open only once, others several times. Do learn about the structure of a daisy "flower" before tackling these. For some species like Hakeas and Banksias with spikes of flowers the number of newly open flowers as well as the time of opening is of interest. What might control time of flower opening and pollen shed? Do you expect differences in opening time on cooler days, wet days, and overcast days? Do you expect any difference in time of pollen shed between flowers pollinated by bees or moths, or wind? Click Project 4-10 for Prof. Jennifer McComb's resource sheet.
 |
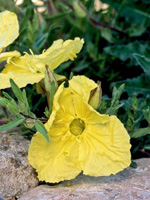 |
| Mirabilis jalapa (The four o'clock flower) opens in mid- to late-afternoon and closes again the next morning. | Hartweg's Evening Primrose (Calylophus hartwegii) opens in the evening and closes the next afternoon shortly before new flowers open. |
Wind borne pollen
Pollen carried by wind can be taken to very high altitudes or hundreds of miles out to sea. However the distance from the parent plant that most of the pollen actually gets may be surprisingly small. Selecting a pollen source is the difficult bit. It must be a plant that sheds lots of pollen and the pollen must have a distinctive shape. There must be no other plants of this species in the area. Neither can there be plants of another species with a similar sort of pollen in the area.
A suitable plant would be a pine tree (an introduced plant) on a farm with no other pines around; a patch of Juncus (rush) in a wet spot with no other rushes (or bulrushes) around etc. Are you going to expose slides only on the windward side of the tree or on all sides. How are you going to arrange to have slides exposed all at the same time? For how long will you expose slides? Will you shut down your experiment if the direction of the wind changes? What environmental factors will you monitor while the slides are exposed? Click Project 4-11 for Prof. Jennifer McComb's resource sheet.
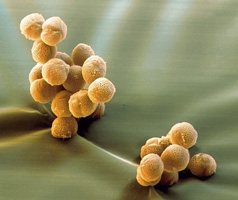 |
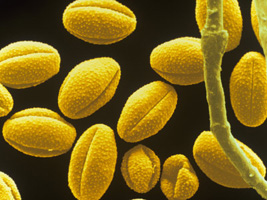 |
| Coloured scanning electron micrograph (SEM) of pollen grains of the elder tree, Sambucus nigra. These grains are wind-borne pollen. | Absinthe (Artemisia absinthium) wind-borne pollen may cause allergy in some people. |
A pollen calendar
Pollen in the air may cause hay fever in susceptible people. For this reason in spring and early summer, daily pollen counts are carried out in some cities and the results published in newspapers and on the internet. For an student experiment you could compare published data with what you can collect in your own district. Pollen can be collected by the gravity method - expose slides coated with vaseline for one day. What other "objects" apart from pollen might you expect on your slides? How are you going to identify the pollen you find? Could a local doctor or hospital give you data on frequency of onset of asthma to correlate with your pollen counts? Perhaps you could investigate and compare the accuracy of various methods. Click Project 4-12 for Prof. Jennifer McComb's resource sheet. Examples of pollen calendars for Queensland and Australia can be seen at
http://www.weatherzone.com.au/pollen-index/qld/brisbane/brisbane and an allergy calendar at
http://www.allergy.org.au/content/category/3/48/241/
 |
| Pollen calendar from the UK |
Pollen in honey
Some people claim they are allergic to honey because of the pollen it contains. During spring, bees flit from flower to flower and collect nectar, inadvertently collecting pollen from the flowers they've visited along the way. The honey that they produce will therefore contain some of these pollen. Honey is sometimes sold with the different flavours kept separate (e.g. karri, white clover etc.) but more often as a blend. The question is whether different sorts of honey have a distinct range of pollen types. Note, however, that commercially produced honey may not contain pollen as these are filtered prior to bottling. Honey from small backyard producers are your best bet.
A study by Helbling and co-workers (reference below) showed that 75% of honey-allergy sufferers were sensitive to dandelion honey. For an student experiment would you just score presence or absence of various sorts of pollen or are you going to estimate frequency as well. How are you going to identify the sort of pollen that you find? (it may be impossible, in which case good drawings should be made). Are you going to "stick" to local pollen or look at some from overseas as well. Click Project 4-13 for Prof. Jennifer McComb's resource sheet. Note: this student experiment does not involve manipulating variables; instead it relies on natural variation. See "Allergy to honey: relation to pollen and honey bee allergy" by A. Helbling, et al, Allergy, V 47, No. 1, pages 41–49, February 1992.
 |
 |
| Honey bee collecting pollen | Dandelion pollen (pictured) is notorious for causing allergies in honey. |
What causes the death of annual plants?
Some trees live for thousands of years but at the other end of the scale annual plants die after a year or less - why? It is not fully understood but it is known that you can extend the life of annual plants by removing the fruits. A good project would be to investigate how long you can extend the life of the plant if you remove the flower buds; the flowers after pollen is shed, the young developing fruit, the immature fruits, the mature fruits? However, this may take to long to carry out and only be successful if you began earlier than the rest of your class.
As a related issue you might compare the total yield of fruit from your plant if you remove fruit as it matures rather than do one harvest when the plant dies. Plants like legumes or tomatoes which flower on side branches are suitable to use, but you might also like to include something like sunflower in which the top growing point is "used up" in producing the inflorescence. Click Project 4-15 for Prof. Jennifer McComb's resource sheet.
 |
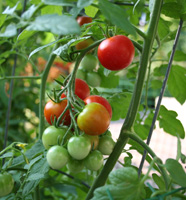 |
 |
| If you want to form just a few large pumpkins fruits per vine, pinch off pumpkin blossoms and small fruits. The plants will send more energy into the remaining fruits and they will grow larger. | If tomato transplants have small fruit at planting time, remove fruit to prevent stunting the plants. | Start thinning gooseberries during late Autumn, removing about half the crop. This will give a longer cropping season and leaves others more room to grow to a larger size. |
Seed germination
The environmental conditions that stimulate seed germination are poorly understood for many Australian native plants. For an interesting student experiment you could investigate the conditions needed for germination of several related species, particularly those with horticultural value. Hint: select species for which you can obtain large number of seeds so that you can have a good experimental design. Try and find out when the seeds germinate in the field as this might help you determine the most likely treatments to use. Avoid using orchids as they may have very special requirements like a suitable fungus being present.
Factors to investigate include: hard seed coats (common in legumes); an impermeable seed coat (prevents water uptake); germination inhibitor (causing dormancy) - some seeds contain substances that prevent germination and these inhibitors are leached out over a period of time (maybe years); temperature requirement (many seeds will germinate only at a particular temperature); light requirement (some seeds require light to germinate (often fairly small ones) or just the opposite - they won't grow except in the dark. Think carefully about how many factors you can test with the number of seeds you have in hand. Click Project 4-18 for Prof. Jennifer McComb's resource sheet.
 |
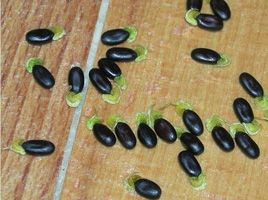 |
| Smoke is a critical factor for promoting germination of seeds in areas subject to bushfires. For example, Grevillea and Hakea (Proteaceae) germinate in response to fire-related cues such as heat and smoke. The seed coat is responsible for dormancy in G. linearifolia (pictured). | Acacia seeds need to be pre-treated with near-boiling water. Then the seeds are then ready for sowing. This photo shows < lang="EN-GB" style="; font-family: Verdana"> Acacia baileyanna seeds with the radicle emerging after boiling water treatment. |
Dispersal of plants in clothing, towels and rugs
Humans may unknowingly carry around weed seeds particularly if they have brushed past plants or gone for a bushwalk. Surely you've walked through long grass and found your socks covered with Cobbler's Pegs which you've picked out at home and disperse. Pretty clever seeds!
Interesting research has been done by Ken Scott from the School of Environmental and Life Sciences, Charles Darwin University (reference below). He investigated the potential of Gamba Grass (Andropogon gayanus) seeds to be dispersed unintentionally attached to the clothing and backpacks of four people while performing field work in a Gamba Grass-invaded savanna in northern Australia. Gamba Grass seeds attached to, and were carried by, each subject during the course of field work. One person carried 65 seeds, while another carried just eight. They stuck to water bottles, and in the crevices of shoes and socks, rather than on the exterior of clothes.
This suggests an interesting topic for an student experiment and it would be worth reviewing his journal article. Perhaps you could look in or on shoes and boots, stuck in tread or on shoe laces; in socks, trouser cuffs and pockets, on coats (particularly sheep skin coats), beach towels, travel and picnic rugs car floor mats and car carpets. Maybe a friend living in a country area will clean his door mat for you and send you the specimen (it is illegal to send soil specimens interstate).
Reference: Kenneth A. Scott, Ecological Management & Restoration, 2009, Vol. 10, No. 1, pp. 71-73. Click to download.
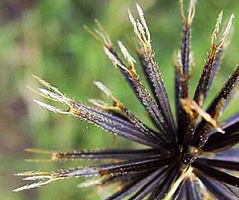 |
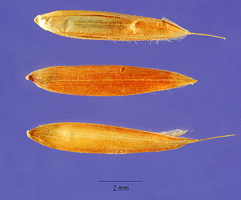 |
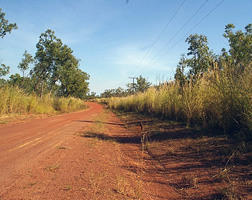 |
The extraordinarily efficient barbs of the Cobblers Peg (Bidens pilosa), otherwise called "Farmers Friend" because the seed sticks to you. |
Gamba grass seed has little barbs that make it stick to everything. It is a Class 2 declared pest plant in Queensland. It was introduced into far north Queensland as cattle feed but it also has significant negative impacts. | Gamba grass roadside infestation on Rum Jungle Lake road Northern Territory. It invades non-grazed parcels of land such as conservation areas, semi-urban residential land and mining leases and can replace native grasses thereby reducing natural biodiversity on non-grazed land. |
Dispersal of plants by vehicles
Vehicles may carry seeds in cracks or in mud and provide a threat to quarantine barriers. For example, cars brought in from overseas are steam cleaned before being delivered to their owners. You could survey the seeds/plant material carried by a range of vehicles. You could compare what is caught in say tyre tread of different vehicles or you could deliberately wash a vehicle thoroughly before a long journey, or a journey through a scrubby area and then wash it again afterwards. How will you identify what grows? How will you know if everything has germinated? How long will you wait for things to germinate? Click Project 4-20 for Prof. Jennifer McComb's resource sheet.
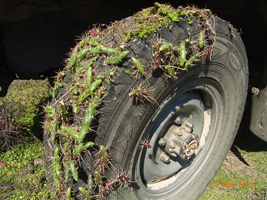 |
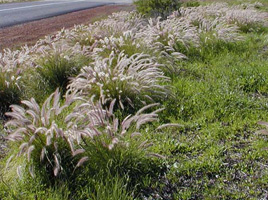 |
| Tiger pear (Opuntia aurantiaca) is a native of South America. It is believed to have been introduced into Australia as an ornamental garden plant during the early 1800s.The segments, easily detach from parent plants and attach to passing animals, humans or even to the tyres of motor vehicles. Tamworth NSW | Feathertop grass (Pennisetum villosum) grows along roadsides as it is dispersed by car tyres. It is a pest and has to be constantly mowed by local councils. |
Germination and establishment of mistletoe
Mistletoe seeds are easy to germinate but adult plants occur on a restricted range of hosts. Is this because seeds never get deposited on other plants? Or if seeds do arrive on other plants, how big does the hopeful mistletoe grow before it is prevented from attaching? The common mistletoe Amyema preissii is found mainly on Acacia but also on Cassia and Eucalyptus. This project is particularly suitable for students living in the wheatbelt of Western Australia where heavy infestations of Acacia acuminata occur but could be adapted for other species and locations. Click Project 4-21 for Prof. Jennifer McComb's resource sheet.
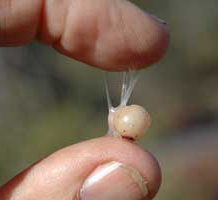 |
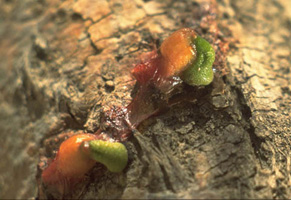 |
| If you break the skin of a mistletoe berry, you see a liquid, transparent viscous liquid and a milky-white little ball of firm pulp in which there is one single seed. | Mistletoes are dispersed by birds. Chemicals in the fruits of mistletoes may manipulate the passage rates of the seeds through the digestive systems of these birds and, in so doing, manipulate the probability that seeds are defecated on host trees that are genetically similar to those that they are locally adapted to (in this case an Acacia raddiana host). |
Competition between weeds and desirable plants
Everyone hates weeding the garden. It is known that weeding vegetables during the early weeks of their growth gives a big increase in final yield, but that weeds established after a certain time have little effect on yield. That suggests an interesting student experiment: could you find out when you can hope to stop weeding your vegetables? There are two ways of tackling this. You might plant the vegetable seeds and let the local weeds do their thing, or you might start in weed free soil and deliberately plant weed seeds at a certain density at specific times. The second approach gives a better experimental approach as you can control density of weeds. Click Project 4-22 for Prof. Jennifer McComb's resource sheet.
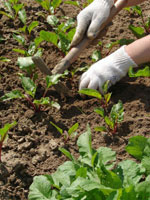 |
 |
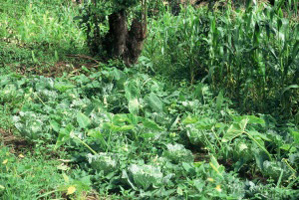 |
| Weeds are many home gardeners' biggest enemy. | Roundup and other chemicals may seem like the best weapon in the arsenal against weeds. However, many experts discourage the use of chemicals. They can leach into fruits and vegetables. | Severe weed infestation can lead to total crop failure. Even normal conditions of weediness cause very significant losses to the farmer, perhaps 50% or more of their yield. |
Competition between Introduced and Native species
This is a fascinating student experiment developed by my colleague Adam Delroy at Moreton Bay College for a Year 10 Technology and Applied Science (STEM) course but equally suitable for a Year 11 Biology project. It is based on the research by Jennifer Firn, Yvonne Buckley and others at QUT Brisbane.
It concerns the threat posed by the introduction of invasive plant species, including grasses, into the prairies, steppes and savannahs across the planet. To counter this it is imperative that scientists greater understand the competitive interactions of natives and invaders. A quarter of the Earth is covered in grasslands. They are highly endangered ecosystems. There are examples of invasive species affecting native species by competitive exclusion and ultimately extinction. The problem is worsened by global warming which will lead to atmospheric CO2 enrichment, climatic warming, rain addition and atmospheric nitrogen deposition. Different plants are differently susceptible to these factors.
In this study, the researchers measured competitive interactions among an invasive grass and two Australian native grasses that are functionally similar and widely distributed. They conducted a pair-wise glasshouse experiment, where they manipulated both biotic factors (timing of establishment, neighbour identity and density) and abiotic factors (nutrients and timing of water supply). They found that the invader significantly suppressed the performance of the natives; but its suppression ability was contingent on resource levels, with pulsed water/low nutrients or continuous watering reducing its competitive effects. The task we developed at MBC involved the competition between the natives Microlaena stipoides, (weeping grass) or Elymus scaber, (wheat grass) and/or invasive (Eragrostis curvula, african 'lovegrass' grasses to better understand the biotic and abiotic conditions for survival/competition. The research questions the students asked were:
BIOTIC FACTORS
1. Is the invasive supressed or facilitated by the presence of the native (using continuous water/high nutrient)?
2. Is the native supressed or facilitated by the presence of the invasive (using continuous water/high nutrient)?
ABIOTIC FACTORS
3. Do either invasives or natives prefer pulsed water or continuous water?
4. Do either invasives of natives prefer high nutrients?
The results were fairly ambiguous but next year we will modify the design. The task sheet can be downloaded here. A copy of the Firn et al Oecologia paper can be downloaded here.
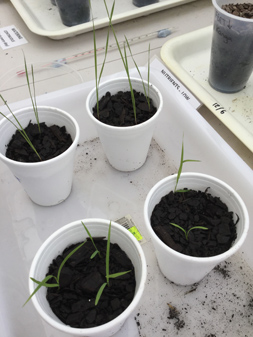 |
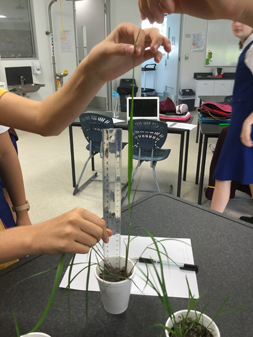 |
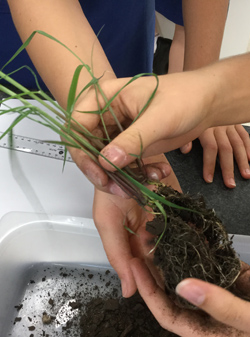 |
The seedlings after a week in the College greenhouse. The weeping grass came through first. |
After 7 weeks the african love grass was up to 55 cm tall. Thanks to Siobhan and Maddie. |
The african love grass had huge roots and suppressed the native. (Siobhan and Maddie) |
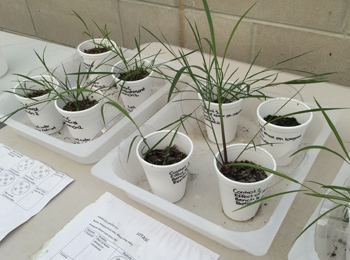 |
| Just before harvesting in week 7. The native seems to have supressed the love grass but results are somewhat mixed. (Taylor, Katherine, Elle, Molly). |
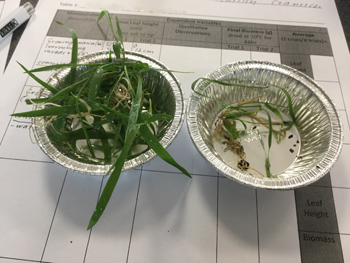 |
 |
| Biomass testing - now for two days in the oven at 70°C. Thanks to Caitlin and Phoebe. | After two days the grass was ready to be weighed. Thanks to Bella, Zahra, Zoe, Yathu and Sapna. |
Growth of weeds
Many persistent weeds owe their nasty reputation to their ability to regenerate from either seeds or from vegetative structures and to their ability to grow up from considerable depths. For an student experiment, you might investigate for example the depth from which bulbs of Oxalis (sour sob) or runners of kikuyu grass, etc. will emerge. Alternatively, you might investigate how small a piece of couch, veldt or crab grass is sufficient to establish a new plant.
Although weeds are very successful in your garden, for experimental purposes it is better to grow them in pots or seed trays so you can control the experimental conditions more easily. How are you going to standardize the material you start with - bulb weight, size, number of nodes on a runner, its length? Are you going to leave existing roots and leaves on or cut them off etc.? If taking small bits off a runner it may be important to note the physiological age i.e. how far back from the apex a particular piece is taken. Click Project 4-23 for Prof. Jennifer McComb's resource sheet.
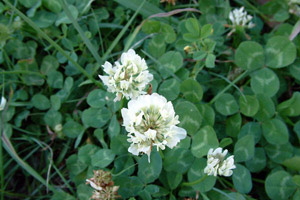 |
 |
 |
| Clover is a very common weed of lawns. It has leaves with three leaflets, and creeping stems that set roots at whatever point they touch the ground. Clover is a member of the pea family, Fabaceae. This means clovers can fix nitrogen from the air and therefore they favour poorly fertilised lawns. | Bindii is the curse of homeowners and children. By the middle of spring each rosette of leaves contains a flower head with many spines. Seeds mature and drop from the plant by about the middle of summer. | Kikuyu is a perennial ground-hugging grass which spreads by runners. It is cultivated for pastures, lawns and playing fields and is a common weed of gardens and roadsides. It is recognised as a weed in Queensland and spreads from deliberate plantings and sites where garden waste is dumped. |
Ecological effects of plant chemical
s It has been known for a long time that some plants grow well together while in other cases one plant seems to prevent the growth of another by the chemicals it produces. This is termed allelopathy. An interesting student experiment would be to find whether there is a scientific basis for the observation that various species of plants can inhibit the growth of other plants. Organic and inorganic substances including growth regulators can be leached from the leaves or roots of plants by rain, influencing the growth of nearby plants of the same or different species. Volatile substances are also known to be effective. Plants that are affected can be of the same species and/or different species. Insects too can be repelled.
There is much non-scientific literature on companion plants, and some of these observations might be explained by allelopathy. However, studies by CSIRO concluded that allelopathy is likely to be a cause of understorey suppression by Eucalyptus species especially in drier climates (reference below). How will you first prove that allelopathy exists in your system? How will you then find out where the toxin is coming from? Click Project 4-24 for Prof. Jennifer McComb's resource sheet. Reference: An Assessment of the Allelopathic Potential of Eucalyptus, FE May and JE Ash, 1990, Australian Journal of Botany 38 (3) 245 - 254.
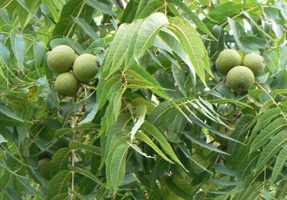 |
 |
 |
| Probably the most well-known allelopathic plant is the black walnut (Juglans nigra) tree. All parts of the tree - roots, bark, leaves, nuts, and even rainwater that falls off a leaf–release an allelopathic substance called juglone. | Casuarina equisetifolia litter completely suppresses germination of understory plants as shown here despite the relative openness of the canopy and ample rainfall (>120 cm/yr) at the location. | In this high school biology experiment, the student looked at the effects of allelopathic compounds from each of daffodils, apples and lemons on the germination and early growth of lettuce seeds |
Litter decomposition
The breakdown of leaf litter is an important part of the cycling of nutrients in the ecosystem. You could do some experiments to relate the rate of decay of leaf litter to the nature of the plant tissue involved, the soil organisms present and the soil water supply. The succession of fungi associated with the decomposing leaf litter of Eucalyptus regnans was studied by the CSIRO in order to relate the degree of decomposition of the leaves to the mycofloral population. Species of Coelomycetes and some Moniliales were the important initial elements of the mycoflora in the litter, but species of Penicillium and Mucorales succeeded them on leaves in advanced stages of decomposition.
For an student experiment you could use leaf tissue of contrasting types - Eucalypts, pines, Banksias, and herbaceous plants like cape weed, clovers, grasses etc. How will you study the "nature" i.e. hardness of the plant tissue involved? How will you get comparable initial samples of different species which have different shaped leaves? Click Project 4-25 for Prof. Jennifer McComb's resource sheet.
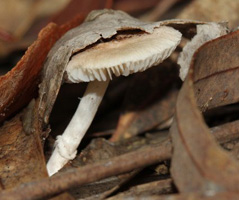 |
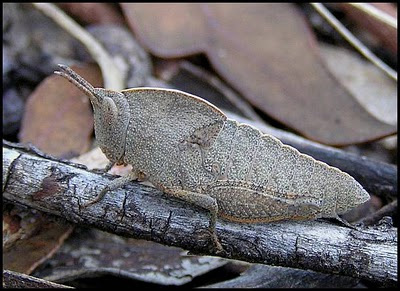 |
 |
| Fungus decomposing Eucalyptus regnans litter. | Can you see the camouflaged 20mm flightless nymph Gumleaf Grasshopper, Goniaea australasiae, amongst the decaying eucalypt leaf-litter? Click the image to see a close up of it. | Coelomycetes on a cashew leaf. |
Marine environments
Each year many tonnes of leaves and wood from terrestrial plants are deposited in lakes and rivers and eventually carried out to sea. This suggests a good student experiment: you could study the rate of decay of various types of plant material under water. You may wish to compare the rate of decay of material submerged at different depths or buried in the substratum. It might be of interest to compare the rate of decay in an anaerobic stagnant swamp mud and a fast flowing clear stream. Click Project 4-26 for Prof. Jennifer McComb's resource sheet.
 |
 |
 |
| Eucalypt leaves were placed by CSIRO at two sites in an intermittent stream during summer to examine the hypothesis that terrestrially-exposed leaf litter accumulates a richer microbial flora than submerged leaves. | In woodland streams, leaf litter is an important energy source and, among the fungi, aquatic hyphomycetes play a pivotal role in the decomposition of dead leaves in these ecosystems. | There are biologically important differences among leaves of different species that may affect microbial community structure, decomposition, and nutrient avaiability - in this case - underwater. |
Litter under trees
Many people hate raking leaves off lawns so they plant evergreen eucalypt trees rather than deciduous trees in their gardens. It seems however, that eucalypts drop leaves, twigs, bark, flower parts and fruits in vast amounts and the gardener hasn't solved this problem. This is even greater when all the litter falls into a swimming pool and blocks the filter.
For an student experiment you might like to compare the seasonal occurrence of litter beneath eucalypt and deciduous trees (but recognise that this would have to be over a longer period of time than a normal student experiment). You may also compare pines. How many replicate trays should be used? Are you going to work in a garden situation or a native stand of eucalypts?
There is an interesting research article by Prof. Ray Specht and Yvonne Brouwer from the University of Queensland Botany Department entitled "Seasonal Shoot Growth of Eucalyptus species In the Brisbane Area of Queensland" in the Australian Journal of Botany, V 23, No. 3, 1975, pp. 459-474. The appendix contains data on leaf fall for many Australian native plants. Click here to read this appendix. Also, you can click Project 4-27 for Prof. Jennifer McComb's resource sheet. Note: this student experiment does not involve manipulating variables; instead it relies on natural variation.
 |
 |
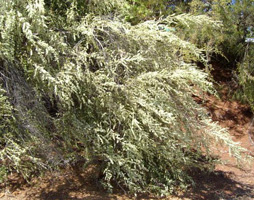 |
| Acacia aneurasheds leaves at the greatest rate from August to November. | For Eucalyptus regnans it is from Dec-April. | ... and for Leptospermum, the time for greatest leaf fall is Oct-Jan |
Growth of isolated roots in sterile culture
Various parts of a plant are normally linked together - leaves, stems, roots, etc. but by growing the parts separately under sterile conditions it is possible to find out if each can grow independently, or whether it is dependent on material passed from other parts of the plant. You might like to try and get tomato roots to grow cut off from the top of the plant. Even to get the initial cultures growing well is an achievement but having mastered this you might like to investigate which tomato cultivars grow best, or to try using other plants. You could also compare growth in the complete medium compared with growth in distilled water, or water with 20% sucrose.
If you are preparing your own media you could investigate the effect of different levels of sucrose, or of leaving out the vitamins. Click Project 4-28 for Prof. Jennifer McComb's resource sheet. Click here for Jennifer's "Sterile Media" instructions.
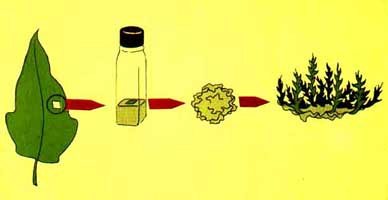 |
 |
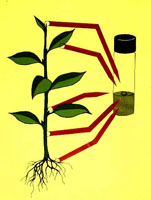 |
| The standard protocol for performing plant tissue culture experiments is fairly basic. It involves production of plants from very small plant parts grown aseptically (free from any microorganism). | Sweet cherry micro propagation. The container allows the environment and nutrition to be controlled. | Areas of tissue culture collection - buds, nodes, leaf segments, root segments. |
Plant callus culture
As a plant grows the cells in various organs mature and stop dividing. However, under certain conditions such as wounding, some cells can be stimulated to divide and form a mass of disorganised (= undifferentiated) cells called a callus. This can be used in studies of plant biochemistry, mutation, regeneration of shoots and roots from the callus and plant breeding. You might attempt to grow a callus from the stems or roots of some plants in sterile culture. Carrot root is a good tissue to start with.
The method involves sterilizing the outside of the carrot then cutting out small pieces and placing them on a medium containing hormones that cause cells, particularly parenchyma and cambial regions to start dividing. Click Project 4-29 for Prof. Jennifer McComb's resource sheet.
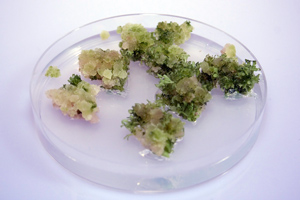 |
 |
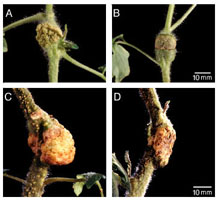 |
| Callus Nicotiana tabacum. In biological research and biotechnology, a callus of cells is a mass of undifferentiated cells. In plant biology, callus cells are those cells that cover a plant wound. | Callus growing on a tobacco plant (Nicotiana tabacum). | Comparison of crown galls (callus) on wild-type tomato (A and C) and the genetically engineered B and D type where it is smaller. |
Haybale fires
Over the warmer months Rural Fire Services throughout Australia are called to extinguish fires in stored hay as a result spontaneous combustion. These fires are usually the result of a combination of storing hay that is too moist and warmer temperatures. These fires can lead to the loss of valuable feed and stored machinery as well. The phenomena of exploding haystacks has been with us for as long as we have been making hay. Pliny, the Roman Philosopher wrote in 60BC "When the grass is cut it should be turned towards the sun and must never be stacked until it is quite dry. If this last precaution is not carefully taken a kind of vapour will be seen arising from the rick in the morning, and as soon as the sun is up it will ignite to a certainty, and so be consumed". Old microbiology books often contain anecdotal evidence of haystack explosions, one from 1939 states "The stack that sets itself on fire does so in a curious way dependent at first upon both moisture and microorganisms. A really dry stack of hay won't heat spontaneously; a really damp stack can't be set fire to".
Even though hay bales may seem dry, they are actually quite moist. Hay that is considered 'dry' has up to 20% moisture content. Although hay should be stored at about 15% humidity for the best conservation, it is often baled at much higher moisture levels. There are many reasons for this: moist hay has less leaf loss (major nutrients are in the leaves), sun drying reduces its quality, and, most importantly, climatic conditions often do not allow adequate drying.
When hay is bailed and the plant material is either too green or has excess moisture (over 30%, as a result of rain, dew, flood water, etc) it continues to respire, generating heat and water which emerges as a vapour through the leaf pores. Within the confines of the bale, the water condenses and spreads by capillary action. This initiates and promotes fungal and bacterial growth in the bale. These micro organisms produce heat and along with higher external temperatures and humidity, and can reach a peak of 70°C at about 5-7 days. If the relative humidity in the middle of the stack is below 95% then the microorganisms become inactive and the temperature of the stack drops. If the relative humidity in the middle of the stack is above 97% then the resultant heat of vaporisation of the water dissipates the heat rapidly and the temperature of the stack drops. This explains why very wet silage does not explode. However if the narrow window of 95%-97% relative humidity is obtained then the microorganisms continue to produce heat, which cannot escape, which raises the temperature. This temperature rise accelerates the chemical oxidation of the hay releasing more heat quickly raising the temperature within the bale to ignition point (200-280°C) where it will burst into flames.
It all depends on the size and shape of the bale, the moisture content and how tightly it is packed. Even if it doesn’t catch on fire the presence of micro-organisms can be a health problem: a disease known as Farmer's lung disease - a pulmonary affection caused by an allergic reaction to the inhalation of these thermophilic actinomycetes and molds. Farmer's lung typically produces shortness of breath, cough, and fever. If not adequately treated, this disease can lead to severe and irreversible lung damage. This suggests a great student experiment and one with great social and economic importance.
A traditional method of monitoring hay stack combustion potential used by farmers has been to poke a section of steel rod into bales in the hay stack and leave for several hours before removing it and feeling for any heat build-up. But for an student experiment you have to do better than that.
 |
| A truck carrying a load of hay bales caught fire on the southeast outskirts of Winnipeg (Canada). CBC News Manitoba October 3, 2010. |
However, if you are using a standard rectangular bale you can just push a thermometer in to it. For a big bale you would need to get a length of metal pipe with holes drilled in it and bash it into the bale – and then lower a thermometer (attached to a string) gently down the pipe until it is centered.
The most common bales used in Australia are the two string bales, which are approximately 900mm long x 450 mm deep x 350 mm high (16 kg). A prime shredded lucerne hay bale costs about $13.
MORE PLANT SUGGESTIONS
Many of the suggestions below involve rates of change (growth rate, germination rate, transpiration etc). You should read the note on "identifying variables" in the description of the "best conditions for growth of a plant" student experiment above.
- How does cold storage affect the germination of seeds? Possible factors: type of seed, length of storage, temperature of storage.
- The effects of wind speeds on the rate of transpiration of Tristaniopsis laurina
- The relationship between speed of germination and growth rate
- Allelopathic effect of eucalyptus grandis on the germination and growth of erica sativa. It may be hypothesised that allelopathic qualities of E. grandis will inhibit the growth of E sativa; thus soil samples taken from the base of E grandis will contain the highest amounts of allelochemicals.
- Pathogenicity analysis of Colletotrichium species isolates from strawberries and alternative hosts. It has been hypothesised that all the strawberry camarose plants excluding the controls, will exhibit symptoms of plant collapse, such as wilt within 4 weeks of being injected with Colletotrich species cultivated from 10 different isolates, providing that all environmental conditions are ideal for disease development, confirming the pathogenicity of the 10 isolates.
- Different planting depths will effect the germination rates of seeds.
- The relationship between the success of chitons and the rocky substrate they inhabit. Soil with higher soil to seed contact (silt) will have a higher germination rate than those in soil with less contact. It has been hypothesised that if the success of chitons was to be compared from a natural rocky substrate to an artificial surface then it is expected that there will be a larger population inhabiting the natural rock substrate due to shelter.
- Chemicals and/or factors affecting the maintenance/survival of cut flowers.
- Response times of sensitive weed under various environmental conditions
- Effect of household cleaners (other household chemicals) on the growth of plants….. including aquatic and terrestrial. Need to justify why they would have an effect.
- Finding the optimum concentrations of a hormone in growing tissue cultured plants
- Plants growing tips will bend towards light, and if the growing tip is removed, the tip will not bend How much of the tip needs to be removed?
- Effect of environmental conditions on the rate of transpiration of plants using a potometer
- The effect of humidity on the germination of plants, fungus, seeds
- The effect of duckweed on nitrogen levels in water
- The effect of light wavelength on the growth of lettuce
- The effect of a natural germination inhibitor on the germination of plants (different species)
- The effect of soil density/depth/structure/type, on the germination/growth rate of plants
- The effect of salinity on the germination of birdseed
- The effect of calcium on the germination of beans
- The effect of pH on the growth of duckweed
- The effect of temperature on the germination of duckweed
- The effect of gibberellins on the growth of roots
- Effect of gibberellins on vegetatively propagated plants … eg basil root growth
- The radishes in the closest proximity to the sweet potato plant will germinate and develop at a slower rate compared to the radishes further away.
- Effect of geotropism on the growth of plants
- Effect of phototropism on the growth of plants
- Determination of the amount of plant mass that needs to be removed to kill weeds
- Effects of ethylene on ripening …. Either ripe bananas or hormone
- Determine what effect if any, the amount of stored food has on the growth of potato buds (eyes)/cane billets/
- Comparison between vegetative propagation of plants and germination of seeds
- Investigate the various methods of seed distribution….. possibly find links between seed types and another factor like germination rates, method of germination etc How would drought affect the rate of photosynthesis in plant leaves?
- How would drought affect respiration in plant leaves?
- How does phototropism affect seedling growth?
- Does grey water/bore water damage root hairs? Make a time lapse video showing growth of root hairs
- Does grey water/bore water affect the rate of germination of seeds?
- Does detergent affect the rate of osmosis in plants?
- Are cell membranes damaged by washing powder?
- Which grass species will grow best in drought conditions?
- Do cacti lose any water in dry conditions? How do they survive?
- Eucalyptus leaves hang vertically in hot weather. Why is this? How could you prove the benefits.
- The rate of fall of, and distance travelled by, winged seeds in relation to their structure.
- Testing for salt tolerance or lead tolerance in races of grasses Growth of duckweed (Lemna species) at different levels of added nitrate and/or phosphate to simulate eutrophication.
- Growth of duckweed (Lemna species) at different levels of added detergent to simulate pollution.
- Population dynamics of plants in permanent quadrants; death rates of seedlings and mature plants.
- Birth and death rates of different leaves on the same plant or leaves on plants from contrasting habitats.
- Mineral nutrient requirements of plants; water and sand cultures. Tissue cultures of plants in sterile conditions on agar. The effects of different water regimes on plant growth.
- Inter-specific interaction between clover and grass; addition of fertilizer. Effects of various wavelengths of light, particularly red: far-red ratio, on seed germination, the tropic response of plants.
- Factors affecting aerial (adventitious) root growth in ivy. Light compensation points of sun and shade plants. Influence of different wavelengths of light on the phototropic response of plants.
CORRELATIONAL STUDIES INVOLVING PLANTS
The following suggestions involve hypothesis-testing research questions not involving artificial manipulation of variables (relying more on natural variation of variables). This type of investigation is known as a "correlational study" as you you look for correlations between variables rather than artificially manipulating them.
- Compare the physiology of different species of leaves (mesophyll cells, stomates, chlorophyll distribution and density)... you may use a microtome to section specimens for microscope viewing. This could be tested with a hypotheses like:
- the higher up in a canopy, the greater the abundance of stomata due to an increased capacity to photosynthesise in the presence of a greater concentration of sunlight;
- the leaves at the top of the canopy will have less mesophyll as they are exposed to more sunlight and therefore would lose more water due to evaporation;
- plants which live in the understory will have a higher concentration of chlorophyll as they must utilise as much sunlight as possible which filters through the canopy.
- Are the stomates on all plants the same size? shape? distribution? Investigate with the Proscope.
- Do young leaves have the same density and distribution of stomates as older leaves? You could investigate with the Proscope. Possible hypothesis: The younger leaves of plants have less stomata due a reduced need for photosynthesis in new leaves.
- What controls the opening and closing of stomata on leaves? Use the Proscope to investigate this. Students could investigate the effects of concentration of sunlight on rate of opening, maximum size of opening and compared to different plants in different environments (rainforest to coastal leaves etc).
- Compare the reproductive structures of flowers, native - exotic; self pollinating - cross pollinating.
- Compare the chlorophyll in leaves from the top of the tree to the bottom of the tree (no manipulated variables).
- Comparison of stomata from plants adapted to different climates/microclimates (dry vs wet environment).
- Trees and grasses will contain different pigments in their leaves.
- Pollen counts, made by exposing sticky slides to the atmosphere on several successive days, correlated with weather data and hay fever suffering.
- Variation in the size of pollen grains in different species of flowering plants.
- The time and location of most active cell division in root tips.
- Thin-layer chromatography of flower pigments in closely-related species.
- Pollination; flower constancy of pollinating insects; pollen identification from insects; flower preferences in relation to tongue length; role of flies in pollen-eating and pollination.
- Mosses and algae on north-south sides of walls or different levels up a salt marsh; distribution pattern in relation to desiccation tolerance.
FUNGUS OPTIONS
Dung Fungi
Fungi play an important role in decomposing animal dung and recycling the nutrients it contains. The spores of these 'coprophilous' fungi are eaten along with the animals food, the fungal hyphae grow in the dung and fruiting bodies are produced on the surface of the pellet. Various fungi appear in succession. A good student experiment might be to investigate the succession observed on different kinds of dung. Alternatively, the fungi that grow on dung from a free running animal could be compared with those from a caged animal fed with pellets.
You might wish to determine which of the fungi are phototrophic (i.e. shoot their spores towards the light) or how far the spores of various fungi can be shot. Click Project 1-1 for Prof. Jennifer McComb's resource sheet. Note: this student experiment does not involve manipulating variables; instead it relies on natural variation.
 |
| There are also various mushroom-producing coprophilous species. This one is Panaeolos sp. on buffalo dung. |
Fungi that break down hair and nails and insect skins
Things like sheep horns, wool and hair, bird feathers, animal nails, insect skins etc., are of keratin and chitin. These are rotted away by fungi called keratinolytic and chitinolytic and a good student experiment might be to investigtae the abundance and rate of breakdown of such fungi in your local soils. Alternatively, you might want to study how fish scales rot away and do some experiments in fresh or seawater with aquatic sediments. How might you actually measure the rate of breakdown? How will you score the frequency of the various fungi so you can compare the different sources of soil? Click Project 1-2 for Prof. Jennifer McComb's resource sheet.
 |
| White Line disease is an infection horses' hooves, caused by anaerobic keratinolytic bacteria. |
Isolation of fungi from soil Many fungi occur in soil
Some are saprophytic on animal and plant remains, others are plant parasites. A few trap and digest soil nematodes and other soil animals. In turn, the fungi are eaten by soil animals like springtails and mites. A good student experiment might be to isolate soil fungi and compare the frequency of different fungi from various types of soil? How will you check that the fungi you grow are actually from the soil and not from faults in your sterile technique? If you are hoping to estimate the number of fungi per gram of soil, at what stage will you weigh your sample? (You will use a lot less than 1 g). Are you going to sample soil from the same place at different times of the year, at different depths, or from a sequence of places along a transect, say from beach through sand dunes into forest, or from burned to unburned areas of bush?
Click Project 1-3 for Prof. Jennifer McComb's resource sheet. Note: this student experiment does not involve manipulating variables, instead it relies on natural variation.
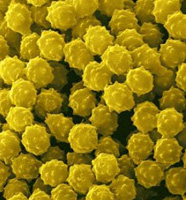 |
| Aspergillus fumigatus conidia (spores). A. fumigatus is a saprophytic fungus and is the main cause of the human disease, aspergillosis (allergic aspergillosis or respiratory infection). |
Nematode trapping fungi
Several fungi in soil can trap and digest nematodes. Some of these fungi produce sticky hyphae or spores which become attached to, and eventually penetrate passing nematodes; other fungi produce ring traps that inflate on contact, or coiled hyphae in which the nematodes become entangled.
A good student experiment might be to grow nematode-trapping fungi and see them catch the nematodes? Are you going to examine one soil type in detail or look at different soil types; sand, compost, mud from gutters, mud squeezed out from mosses, rotting wood? Do you want to do some experiments on why the traps are only produced when there are nematodes present? Will dead nematodes stimulate development; will the liquid in which the nematodes have been growing stimulate development etc.? Click Project 1-4 for Prof. Jennifer McComb's resource sheet. Note: this student experiment does not involve manipulating variables; instead it relies on natural variation.
 |
| Nematode-trapping fungi occur naturally throughout the environment, and more than 150 species have been identified. These fungi have evolved a wide variety of devices to trap or invade nematodes and use these animals as a source of nutrients. |
Freshwater fungi
Some mould fungi live on submerged decaying dicot leaves and produce non-motile spores (conidia) underwater. These fungi (aquatic hypomycetes) have been extensively studied in Europe and America but little is known about them in Australia. Once you have discovered a source of these fungi you might look at their seasonal abundance and their occurrence on different kinds of leaves.
Alternatively, you might compare their abundance in different sorts of habitats - fast flowing streams with tree lined banks (eucalypts and native plants or introduced willows etc.) swampy areas with some water flow (plants like Typha-bullrush and Juncus-rush), or stagnant ponds. How will you figure out from which plants your decaying messy leaves came? How will you distinguish aquatic hypomycete conidia from conidia of terrestrial fungi, moss and fern spores, pollen and so on? Is it possible to determine spore concentration in water by collecting foam or do you need running water for this? If you count spore numbers how will you back calculate to the volume of river water originally sampled? Click Project 1-5 for Prof. Jennifer McComb's resource sheet. Note: this student experiment does not involve manipulating variables; instead it relies on natural variation.
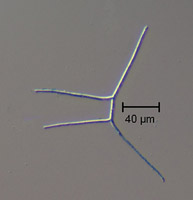 |
| The aquatic hyphomycetes were first recognized by Ingold (1942) and are also referred to as the Ingoldian hyphomycetes in his honor. The one shown here is Tricladium chaetocladium |
PROTIST OPTION
Slime moulds, like Physarum polycephalum are part of the kingdom Protoctista. This is probably the least understood of the five kingdoms of life. One of the most interesting things about Physarum polycephalum is that it shows a quality that could be called primitive intelligence. Studies done by Dr Toshiyuki Nagakaki and colleagues in Japan have shown that Physarum polycephalum can find the shortest distance through a maze. When the Physarum polycephalum organism is chopped up and dropped into a labyrinth (a maze), they put themselves back together and start to move. If a food source is placed at the entrance and exit to the maze, they avoid dead ends in the maze and form a connection (as a single tube) between the food sources.
In all cases, the Physarum polycephalum chose the path that was the shortest between the two food sources. In a way, it "solved" the puzzle of finding the shortest path through the maze! The paper was printed in Nature V407, 28 Sept 2000, p 470 (click to download). At St Ursula's College, Yeppoon Queensland, HOD Science Barbara Pearson said that her students tried such variables as the type of food preferred (start with oats), time taken, complexity of maze, hazards such as light source, use of Vaseline on maze. Plenty of webpages with ideas.
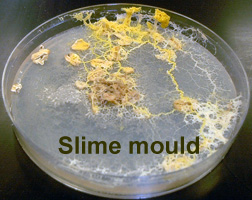 |
 |
| Physarum polycephalum | Photo of slime mould in maze - taken from Nature article. |
ANIMALS OPTION
Note: very strict rules apply to the use of animals in schools in Queensland. Information can be found at the official link Animals in Education.
Effect of temperature on reproductive success of sea monkeys.
Moreton Bay College runs an open inquiry student experiment in Year 12 in which students have to investigate the effect of environmental conditions on the growth and development of an animal (or reproduction if non-vetebrates are concerned). In the one pictured below, this group is considering the effect of temperature on commercial sea monkeys (brine shrimp). Native ones have too long a life cycle to be any use in this experiment. If you want further information email their ever-helpful biology teacher Ms Josie O'Shea: osheaj@mbc.qld.edu.au
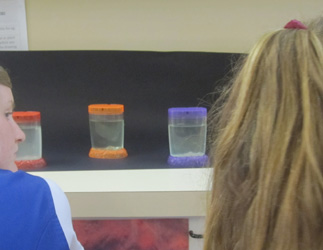 |
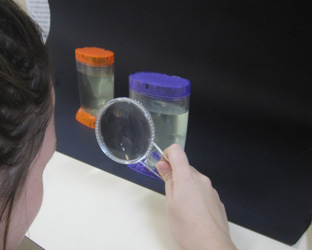 |
| Setting up the equipment. | Counting the monkeys |
Fruit Fly Inheritance
The fruit fly Drosophila melangaster is, and has been in the past, used for a variety of genetic experiments, including the study of genetic inheritance and to discover that genes were related to proteins. The fruit fly lifecycle is useful for students to study as it has a short lifecycle (11-15 days), is fairly easy to maintain and has a number of easily identifiable phenotypic features to study.
In this student experiment students are required to investigate the effect of an enviromental variable (such as light, temperature or pesticide resistance) on the growth and reproduction of the fruit fly Drosophila melanogaster. In the photos below, this group of Moreton Bay College girls is looking at the effect of alcohol. Fruit flies are bought from Southern Biological for $10 per tube and bred up by the lab staff. Each group need about 8 fruit flies per vial (4 males, 4 females) and about 9 vials (3 treatments x triplicate). A few years ago they tried alcohol on food but that was a disaster, then they tried alcohol on cotton balls (no good) and finally settled on alcohol on filter paper.
To analyse "inter-relationships" as per the criteria, it seems logical to try the experiment two ways: 1. control the alcohol concentration (eg 100%) and vary the frequency of exposure); or 2. keep the frequency constant and vary the concentration (30%, 70% 100%, or whatever). To count them, knock them out with carbon dioxide (acid + marble chips + delivery tube). Other variables that could be considered: temperature, type of food, amount of food, size of container on growth, reproduction of flies. One enterprising group even looked at the effect of cigarette smoke. Click here to download the student experiment task sheet as used by Moreton Bay College (my thanks to Josie O'Shea).
 |
 |
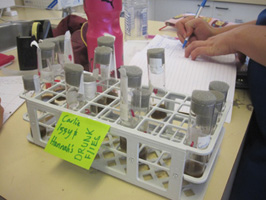 |
| Growing them. | Observing fruit flies in the presence of alcohol. | Carly, Izzy and Hannah's "Drunk flies". |
 |
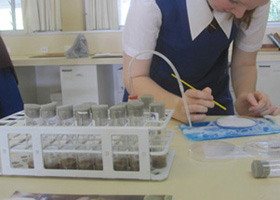 |
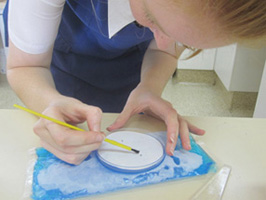 |
| Anaesthetising fruit flies with carbon dioxide gas so that they can be counted and boy/girl ratios determined. | Counting the numbers of boy and girl flies. | Boy, boy, boy, girl, boy, girl, girl. |
Environmental Toxicology: What are we doing to our frogs?
Glyphosate (N-(phosphonomethyl)glycine) is a broad-spectrum systemic herbicide used to kill weeds, especially annual broadleaf weeds and grasses known to compete with commercial crops grown around the globe. It is sold under the brand-names of Zero and Roundup. While glyphosate has been approved by regulatory bodies worldwide and is widely used, concerns about is effects on humans and the environment persist. [Graves, Lucia (24 June 2011). "Roundup: Birth Defects Caused By World's Top-Selling Weedkiller, Scientists Say". Huffington Post.]
Glyphosate is known to be toxic to fish and amphibians. A study published in 2010 proposed commercial glyphosate can cause neural defects and craniofacial malformations in African clawed frogs (Xenopus laevis). The experiments used frog embryos that were incubated with 1:5000 dilutions of a commercial glyphosate solution. The frog embryos suffered diminution of body size, alterations of brain morphology, reduction of the eyes, alterations of the branchial arches and otic placodes, alterations of the neural plate, and other abnormalities of the nervous system. A good biology student experiment may be to investigate the effect of increasing concentrations of glyphosate on tadpole metamorphosis. You will still need to consider ethical implications of your study and check the legislation on use of animals in experiments.
Mealworms eat polystyrene foam
Polystyrene foam (PS) has been used for decades as an insulating material in food containers (eg coffee cups) and as a cushioning material in packaging. It is generally considered to be durable and resistant to biodegradation. However, in September 2015, researchers from the School of Chemistry and Environment, Beihang University, Beijing, China and Stanford University, California, found that mealworms (the larvae of Tenebrio molitor Linnaeus) could chew and eat Styrofoam, a common PS product. The Styrofoam was efficiently degraded in the larval gut within a retention time of less than 24 hours. Within a 16-day test period, 48% of the ingested styrofoam carbon was converted into CO2, and the residue (about 49%) was excreted.
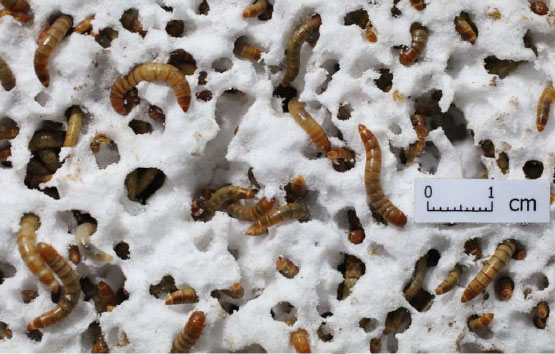 |
Mealworms eating polystyrene. |
Further results indicated the essential role of gut bacteria in polystyrene biodegradation and mineralization, confirmed the presence of PS-degrading gut bacteria in the mealworms. See Environmental Science and Technology: 21 Sep 2015. Their method consisted of placing 500 mealworms in a polypropylene plastic container with a Styrofoam block of mass about 6 g. They used controlled conditions (25°C, 80% humidity, 16:8 (Light:Dark) photoperiod). The mass loss of the Styrofoam block as a function of time caused by mealworm consumption was measured periodically. A test of the survival of mealworms reared in the laboratory solely on a Styrofoam diet in comparison with those reared on the conventional diet of bran.
See http://news.stanford.edu/news/2015/september/worms-digest-plastics-092915.html
Effect of global warming on pest species
The temperature of the earth is increasing due to global warming. Could this increase in temperature lead to increased reproduction rates of pest species?
Effect of global warming on marine species
One side effect of global warming is acid rain. If the pH of the Earth's waters or environment changes could this affect rates of reproduction or the survival of marine species?
Effect of protein on the growth of fruit flies
This is another one done by some students at Moreton Bay College. The manipulated variable is the quality of protein used as food for the flies. One type is semolina, the other is Nature's Way high protein food supplement - both of which contain which contains 18 different amino acids but in different proportions and absolute amounts. The photos below will give you an idea of what was done in this student experiment.
 |
 |
 |
| Semolina contains the same amino acids as Nature's Way Protein Powder but has a greater proportion of non-essential acids such as glutamic acid (36%) and proline (11%) compared to Nature's Way (19% and 5% respectively). Semolina is particularly deficient in the essential arginine (3.6%) and lysine (1.9%). | Nature's Way contains a greater concentration of amino acids (both essential and non-essential) and a greater proportion of essential ones than semolina. | Mrs O'Shea has some clever ideas. |
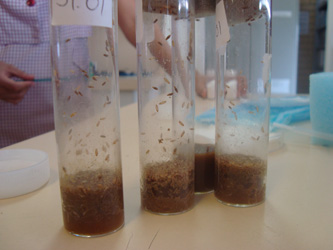 |
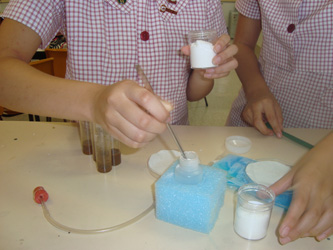 |
| Fruit flies feeding on semolina and Nature's Way. | Adding sodium carbonate powder to hydrochloric acid in the anaesthesising vial to make CO2. |
Effect of temperature on the growth and reproduction of the Common Egg butterfly
These butterflies can be bought from Ross Kendall at Butterfly Encounters,17 Eldon St, Indooroopilly, Queensland Ph 07 3378 1187 or Mob 0402 254 370; Email: ross@butterflyencounters.com.au. He's the guy at Indooroopilly (Brisbane) who keeps the caterpillars under his house and breeds them for weddings. See his webpage at www.butterflyencounters.com.au. I think he's with the Moth and Butterfly Association of Queensland.
Growth response of maggots to various conditions
Suggestion courtesy of Jonathan Grassby, Year 11 Co-ordinator, Craigslea State High School .
Growth rate of chickens eating different feeds
There are several factors that affect the chickens' growth rate and size at harvest. These include: breed, age at harvest, feeding regime, gender (males grow faster), and age of parent flock (ageing flocks produce bigger eggs and the chicks from larger eggs grow faster). Such factors may make a successful student experiment however the code of practice for animals in school scientific investigation lays down very strict requirements on such experiments (see link above). If you plan to do a chicken student experiment you should plan a year in advance.
An interesting investigation is done by some students at Moreton Bay College. They looked at the differences in growth rate depending on the type of food and feeding regime (as mentioned above). Regular and organic feeds were compared. It should be stressed that the conditions for being permitted to do such an experiment would not allow things like restricting food or water, or providing less than optimum conditions for the animals (correct temperature etc). The advice from Biology teacher Josie O'Shea (osheaj@mbc.qld.edu.au) at MBC is to plan well ahead as the obstacles are great.
The photos below provide a stimulus for those considering an student experiment of this type. Some interesting background on feed requirements is provided by the Chicken Meat Federation of Australia.
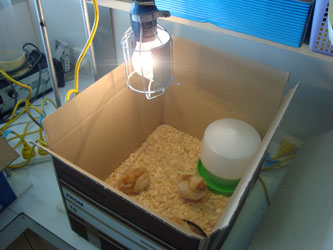 |
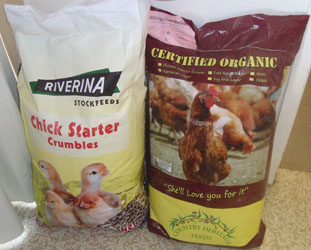 |
| The set up. | The two types of feed being used. |
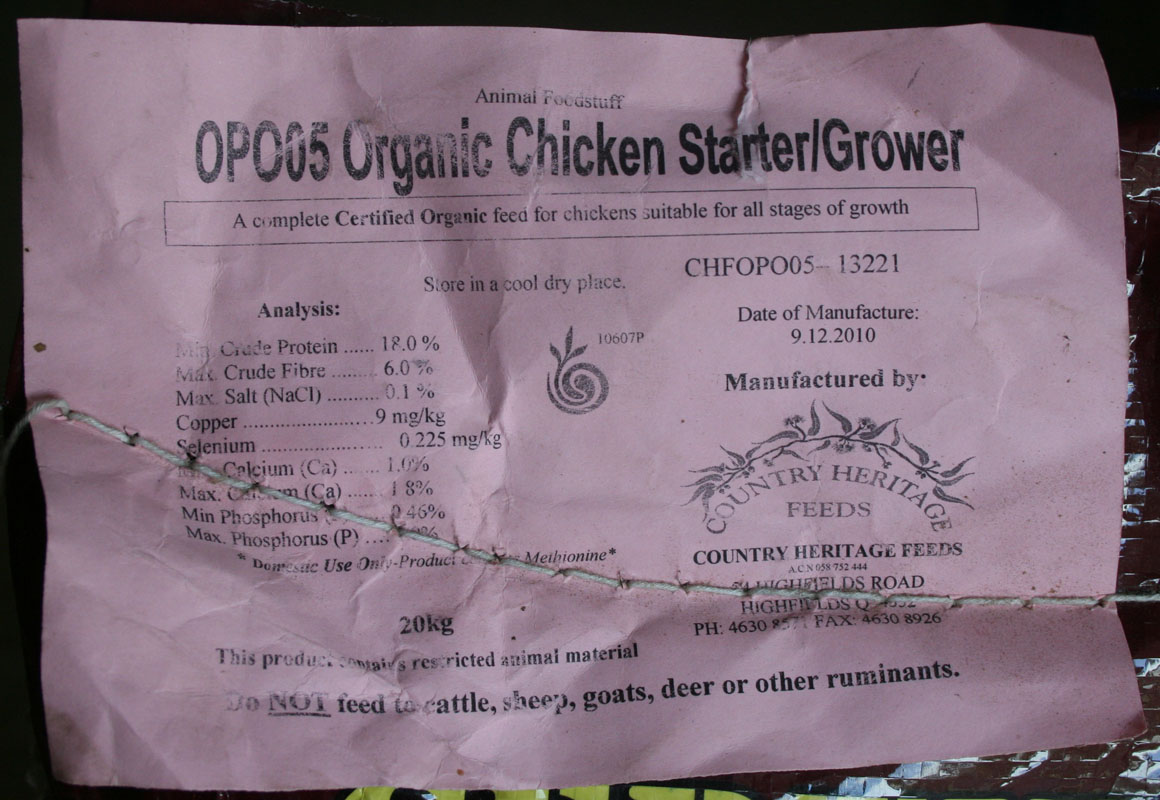 |
 |
| Organic chicken feed. Click photo to enlarge to see percent protein. | Regular chicken feed. Click photo to enlarge to see percent protein. |
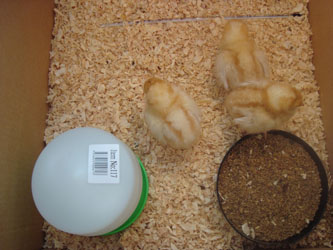 |
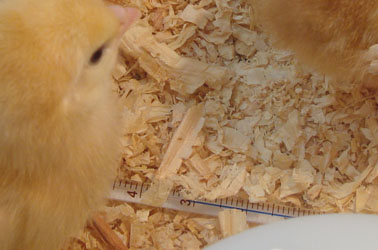 |
| How is access to food controlled - if at all? How can variables be controlled and still meet the code of practice? These chickens are called Tandoori, Tikka and Masala. | Temperature should be between 30 - 32°C. Click photo to see an enlargement so you can read MBC's thermometer. |
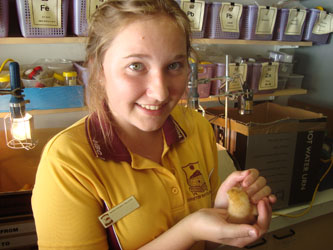 |
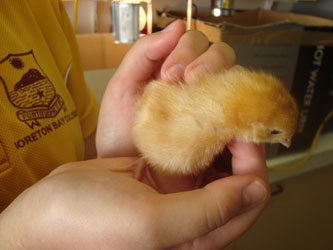 |
| They start off small and cute. | Need to find a good home for them at the end of the student experiment. |
Anaesthetising of barramundi
Clove oil has been used for a number of years to anaesthetize fish in seawater. In fish farming this is essential for performing basic procedures such as weighing, tagging, experimental work and for transport. It considerably reduces pathology risks from stress, injury and accident during handling. Clove oil is distilled from Euglena caryophyllata stems, buds and leaves and has been used on humans for centuries as a local anaesthetic. It is fast, relatively cost-effective and does not harm the fish.
Biology student Cristal Jones of Tully SHS conducted an student experiment to determine the optimum concentration of the Clove Oil Anaesthetic for juvenile barramundi. She speculated that Clove Oil, which is not well known or widely used, could become an alternative to the standard phenoxyethanol, quinalidine or benzocaine which are hazardous, expensive, hard to come by in developing countries and sometimes less effective. The relevance of determining the Optimum Clove Oil Anaesthetic concentration formula for juvenile barramundi extends into industrial and commercial situations, scientific studies, veterinary assessments and also in Aquaculture Facilities such as the Barramundi Ponds in the Tully State High School. Although it is preferable for the induction to be relatively fast with a quick recovery period, this is not always practical.
Cristal recently finished her PhD in the School of Biochemistry and Molecular Biology at the Australian National University and is now working in the biosecurity field. An article in the Weekend Australian (2 Oct 2010) about harvesting eggs from sturgeon to make caviar explains how sturgeon in Australia are anaesthetised harmlessly with clove oil when they are milked.
Click here to download a copy of Cristal Jones's 2003 student experiment. Note: her student experiment is provided as an example of the work being undertaken and is not meant to be an exemplar of an student experiment or of a particular achievement standard.
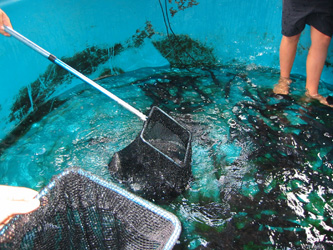 |
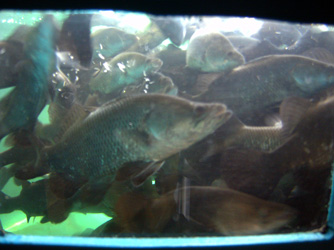 |
| Capturing the barramundi. (C. Jones) | Barramundi in the Tully SHS fish tank. (C. Jones) |
Barramundi experiments
As part of the Great Barrier Reef Marine Park Authority's Reef Guardian Schools program, Tully State High School has established reef related activities to promote the Great Barrier Reef and increase understanding and appreciation of the local marine environment. One of their programs is Aquaculture studies in which they aim to promote understanding of aquatic environments. There is a specialist aquaculture facility on the school grounds where students learn about the advantages, disadvantages and value of aquaculture in the north Queensland region. For Senior Biology students this facility enables them to do some imaginative student experiments on redclaw crayfish and barramundi.
Some of the Research Questions posed by students in their student experiments include:
1. effect of stocking density
2. light / dark effects on growth
3. feed types (pellets, pilchards, prawns, worms (and worm farm worms)
4. which fishing lure is most effective (hooks removed)
5. clove oil anaesthetic - as described above
6. temperature of water
7. water quality (pH, DO, nitrates, phosphates, etc)
8. frequency of feeding
9. clean tank walls as opposed to letting the algae grow on the walls of the tank
10. water depth
11. size of the tank
12. isolation v companionship
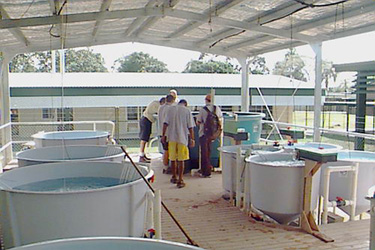 |
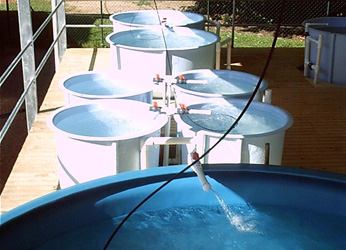 |
| Fish tanks at Tully SHS's Aquaculture Centre | Water filtration |
 |
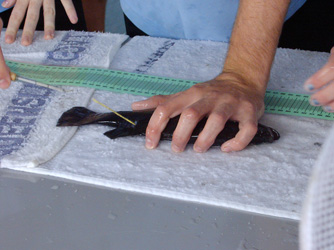 |
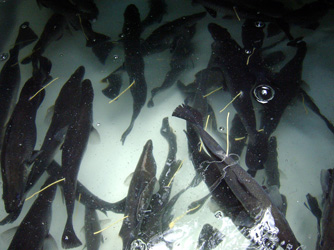 |
| Students performing their student experiment | Capture and tagging a barramundi | Tagged and released |
Soap tree sap as a mullet anaesthetic
Traditional owners of Minjerribah (Stradbroke Island, Australia) are said to have used crushed leaves from the indigenous soap tree (alphitonia excels) for catching fish. Quandamooka man, Matt Burns, who was born and raised at Dunwich on the eastern side of the island said that Minjerribah hunters used the crushed leaves as a fish poison. He said he was told by scientists visiting the Moreton Bay Research Station at Dunwich that the saponin in the leaf extract lowers the surface tension of the water, leading to deoxygenation which stuns the fish and causes them to float to the surface. He said that they would only be stunned for about a minute before they recovered, so they had to be picked up quickly and thrown on to the beach.
 |
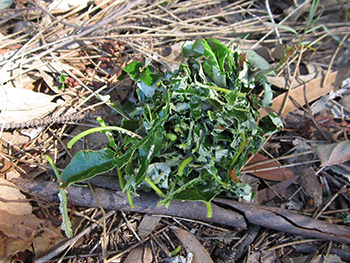 |
| Quandamooka man Matt Burns explaining traditional hunting techniques, including the use of soap tree extract as a mullet anaesthetic. | A ball of wet crushed soap tree leaves prepared by Quandamooka hunter Matt Burns, 8 July 2016. |
The problem seems to be that research so far has found that exposure to saponins initially causes hyperactivity but within 5 minutes all activity ceases and fish suddenly die. Scientists seem unable to find a dose level at which saponins act without causing death. This is unlike clove oil mentioned above. See the paper "Stunning fish" (Betäubung von Fischen) by Deborah Power and colleagues in Archiv Tierzucht (Archives Animal Breeding), Dummerstorf 51 (2008) Special Issue, 78-79
[http://www.archanimbreed.com/pdf/2008/at08si1p078.pdf Accessed 8 July 2016].
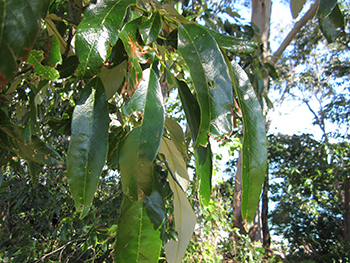 |
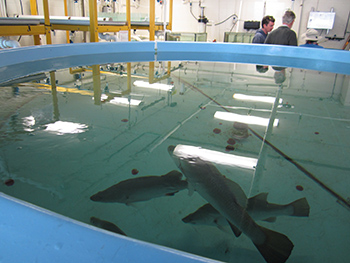 |
| Leaves of the soap tree (alphitonia excels) on the headland at Dunwich. The aboriginal name for Dunwich is Goompee. | Barramundi in the tanks of the 'wet lab' at the University of Queensland's Moreton Bay Research Station at Dunwich. |
UQ's Moreton Bay Research Station at Dunwich would make an ideal place to study the anaesthetic properties of soap tree extract on barramundi or the local mullet but is probably not available to high school students. But you get the idea. Now, who can secure funding to test out the traditional hunting technique.
Redclaw Experiments
Freshwater crayfish native to tropical Queensland and the Northern Territory occur predominantly in the rivers flowing into the Gulf of Carpentaria and some easterly flowing rivers of northern Cape York Peninsular. Unlike other species of freshwater crayfish, the adult male Queensland Redclaw Cherax quadricarinatus has a distinct soft red patch on the outer margin of the claws, hence the name redclaw. Breeding activity is dependent upon water temperature and day length, and normally occurs between September and April within their natural range.
For school experiments protraction of the breeding period can easily be achieved by providing a controlled environment in which temperature is manipulated to simulate the onset of the breeding season. The Queensland Department of Primary Industries (DPI) - now the Department of Agriculture, Fisheries and Forestry (DAFF) - ran a number of redclaw aquaculture projects but these have since been disbanded due to funding cuts some years ago.
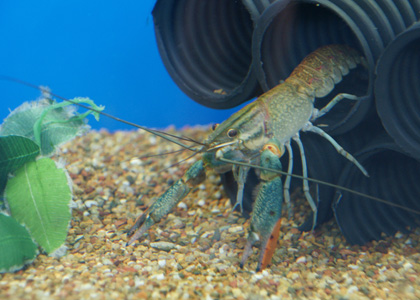 |
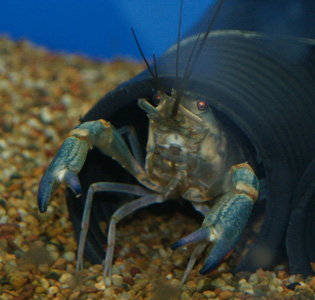 |
| Queensland Redclaw at Woodridge State High School, Brisbane. Photos courtesy of Deanne Blackmore, HOD Science. | |
One of the scientists involved in the DPI project - Wendy Ensbey - is now a Biology teacher at Noosa District High School (Queensland). She said the starting point in a Redclaw student experiment was to read the DAFF brochure at www.daff.qld.gov.au/28_13348.htm. She has given some information (below) in response to questions from teachers:
Question 1. After breeding we have separated males and females adults into two tanks. There has been some cannibalism in both tanks. We are using cut-up pipes as hiding holes. We have read some information about using mesh but are not sure exactly how to use this. Are they mesh bags strung vertically from the surface or do we just put them out in the tanks as places to hide? If laying them out in the tank do they have to be bags or can they just be straight sheets that have been screwed up?
Answer 1. The bags provide a hiding place just like pond weed or other aquatic structures so the shape is less important than the amount of surface area and hence hiding spots. Crayfish just brawl with each other and attack if they can see each other. Two crayfish meeting may fight (either gender) or mate ( if male and female). Also, up to 10% may be hermaphrodite. I believe there was some inquiry into whether the hermaphrodite stage was a transition between sexes but the funding ran out.
Question 2. How much food should we feed the redclaw? We are using the small pellets. Should you supplement with other things? What do you do during the holidays with respect to food (They are in indoor tanks).
Answer 2. The warmer the weather, the more they should eat. To check how much they need, add cracked corn to your tank. It won't decay and pollute the water as quickly as the fish pellets and it is easy to see. When the crayfish clean up the corn you can feed them more pellets. The pellets are a higher percentage protein of course to maximise growth. Can't help with the concept of long term feed as our school farm (Noosa District SHS) has someone present through all holidays.
Question 3. We have been provided with conflicting information as to housing the redclaw. Should we have the girls in one tank and boys in the other or would a combination be better?
Answer 3.It is unimportant keeping the sexes separate because all individuals fight. There is no pecking order other than which one is bigger. Mating occurs if the female submits rather than fighting. Also you have hermaphrodite mystery to complicate things. Keeping the sizes separate is much more important as the big ones are much better at destroying the little ones. You need to monitor when your females are in berry and remove them as the babies will be a tasty snack for any near adult if they fall off their mum. Make sure the babies have lots of hiding areas - like bags.
Question 4. Any specific advice for increasing the chances of survival for hatchlings?
Answer 4. Hatchlings first feed on plankton. An outside position of your tank or a sunny spot to encourage algae growth will help. Murky green is better than crystal clear. Just check your nitrate level stays low and the nitrite stays zero. pH at neutral to slightly alkaline is best.
Daphnia heart rate experiment
Some students have proposed that for their student experiment they will investigate the effect of a variable such as caffeine, glucose or Red Bull on their own heart rate or blood-glucose (or that of a fellow student). "Human subject" experiments for student experiments pose many problems, particularly safety concerns. In fact, many teachers and jurisdictions refuse to allow such human experimentation to occur and it would seem wise to check this out before you go too far (see caution in Homeostasis section below). There is also the problem of the validity and robustness of the data collection (particularly if it is subjective).
One solution to this is to carry out the experiments on insects. For example, you can use water fleas (Daphnia magna), a semi-transparent freshwater crustacean, to study the effects of caffeine on heart rate. You don't worry about having to learn how to take a crustacean's pulse: you can actually see the heart beating under a microscope. This idea came from Ms Sally Lockett - Biology teacher at Ormiston College, Queensland.
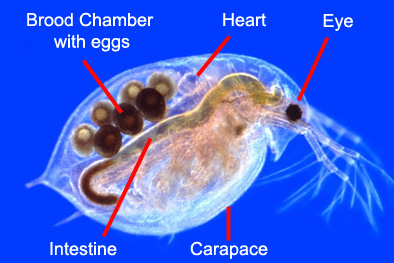
You could also try other chemicals: diphenhydramine (active ingredient in some over-the-counter decongestants such as Benadryl), nicotine, and ethanol. Of course, you will have to negotiate safety issues with your teacher. Like any model system, Daphnia have advantages and disadvantages. On the plus side, they are fairly easy to keep, easy to study, and inexpensive. On the minus side, they are evolutionarily far-removed from humans, so you need to be cautious when interpreting your results. What happens when Daphnia are exposed to caffeine may or may not have similarities to what happens when humans drink coffee. A good webpage to get you started is: Sciencebuddies project ideas - Daphnia
Daphnia - salt concentration on size
Another popular experiment is to consider the effect of salt concentration on the size of Daphnia. This may be suitable for a unit on osmosis.
Beetles as pollinators
Some insects like bees usually collect pollen or nectar from only one species on a particular collecting trip, or even over a period of several days. Consequently, they are very good pollinators as they go from flower to flower of the same species. Other insects like beetles have the reputation of being less selective and of travelling to flowers of different species; they are thus less efficient as pollinators.
For an student experiment you could investigate just what range of flowers a particular beetle visits and consequently the range of pollen it carries. How are you going to keep a watch on the beetle as well as recording the plants it visits in sequence? How are you going to catch your beetle without showering it completely with the pollen of the flower it happens to be on? How will you clean your brush between beetles? What are the floral adaptations for beetle pollination and thus on which flowers are you most likely to find beetles? The abundance of flowering plants of a particular species might influence the animal's behaviour. How will you include this variable in your experiment? Click Project 4-14 for Prof. Jennifer McComb's resource sheet. Note: this student experiment does not involve manipulating variables; instead it relies on natural variation.
 |
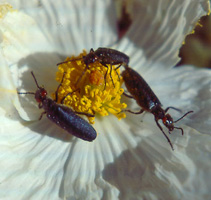 |
| Beetles comprise the largest set of pollinating animals, due to sheer numbers. They are responsible for pollinating 88% of the 240,000 flowering plants globally. | Argemone has flowers pollinated by beetles, which chew on petals, stamens, and stigmas; although they destroy some of these structures, in the process they transfer pollen to stigmas. |
 |
 |
| Parsonsia eucalyptaphylla flower beetles | Just how "pure" is pure? |
Collection of seeds by ants
It has been estimated that there are about 1500 species of Australian plants that are regularly dispersed by ants. The ants are attracted to the seed because it has a firm fleshy appendage (called an elaiosome) and carry the seeds back to their nests. Only a little is known about this issue in Australia and could form the basis of an student experiment. Be aware that this type of investigation does not involve the manipulation of variables but relies on natural variation.
Ant-dispersed plants (dubbed myrmecochorous) are woody shrubs in sclerophyll vegetation. Species in families Rhamnaceae, Fabaceae, Sterculiaceae are commonly ant dispersed as are members of the genera Acacia, Hibbertia, Goodenia. Look up these groups so you can recognize them in the bush. Many species shed their seeds in summer. How will you score your results if ants of several species appear on the scene unexpectedly and a brawl ensues? Are you going to study foraging only during the day or at night as well? Click Project 4-16 for Prof. Jennifer McComb's resource sheet.
 |
 |
| Ant carrying pampas grass seeds. | Rhytidoponera metallica ant holding a seed of Acacia neurophylla by the elaiosome during seed transport. |
Seed survival after ingestion
Not all of the seeds eaten by animals survive the passage through their alimentary canal; thus they end up in the animals' dung. An interesting student experiment would be to find out what proportion of seeds survives the alimentary canal and which seeds are distributed in dung. The experiment could relate seed size and structure with survival in animals with different types of digestive systems. You should select your seeds from those normally eaten by the animals e.g. oats, clover, medic, ryegrass, etc. and possibly include tomato which has a great reputation for survival. If the animals normally eat pellets you can make a mash of pellets and seeds and include these in the animal's food.
It would be interesting to include two animals with a contrasting alimentary canal e.g. hens and rats, sheep and horses. A large animal like a horse produces a vast amount of manure, all of which will have to be washed and sieved so use a small animal unless you are very keen! How are you going to compare live seeds in initial samples (before ingestion) with material which has passed through the animal? Click Project 4-17 for Prof. Jennifer McComb's resource sheet.
 |
 |
| Elephant dung with partially digested marula seeds Kruger National Park , Mpumalanga , South Africa. | Dung of the cassowary from the tropical rainforests of North Queensland showing the undigested seeds of the Alexandra Palm, Archontophoenix alexandrae. The cassowary has a very gentle and fast moving digestive tract, so some seeds pass through them without being fully digested. |
Effect of household detergents on freshwater organisms
Although many detergents are now what is called "biodegradable", degradation takes a finite time, and detergents which by one means or another find their way into rivers, lakes, swamps etc. could be quite harmful before they are degraded. In particular, detergents affect the permeability of biological membranes. You could investigate the tolerance of certain freshwater organisms to various concentrations of detergents. Organisms easily available in sufficient numbers for testing include mosquito larvae, small arthropods such as Daphnia, freshwater snails, fish, the plant Lemna, and tadpoles. As you will be killing animals you may find it less upsetting to knock off invertebrates rather than vertebrates.
It is important to remember are that it is very difficult to measure when a plant is "dead" compared to an animal, and that some animals like mosquito larvae go through developmental stages during the experiment. Click Project 13-1 for Prof. Jennifer McComb's resource sheet.
Gender Distribution and the Territorial Range of Turtle Weed Crabs on Heron Island
Monitor the population growth of organisms that rapidly reproduce asexually. It has been hypothesised that as the turtle weed crab inhabits a clump of turtle weed then the size of turtle weed will not influence the number of crabs inhabiting it because turtle weed crabs are known to only live in pairs therefore no matter what the size of the weed, there will only ever be 2 crabs inhabiting it.
The Effect of pH on the Strength of Keratin (hair protein).
Keratin is a protein that contains a high concentration of the amino acid cysteine; this contains a sulphur atom. The sulfur atoms from two cystines join together, forming a very strong disulfide bond (see below). These bonds are covalent and form strong links making the tertiary structure of the protein very stable. The disulfide bonds occur down the length of the keratin fibre and the cross-linking between the keratin chains account for the strength of hair.
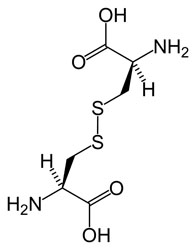 |
| Cystine is composed of two cysteines linked by a disulfide bond (shown here in its neutral form). |
Within each hair strand the keratin chains are also linked with hydrogen bonds between the oxygen atoms on the CO groups and the H atoms on either the OH or NH groups. Although they are individually weaker than disulfide bonds, hydrogen bonds are in much higher proportions to the disulphide bonds making them important in maintaining the tertiary structure of the protein. A good investigation would be to test the strength of hair as a function of pH. Try putting the hair in solutions of varying pH values from 1 to 14 (for say 10 minutes as an initial trial).
SOME OTHERS:
- Monitor the metamorphosis of brine shrimp from cyst to adult
- Gonadotrophic hormone injection of blackbream
- Compare the histology of animals from various classes, families etc and relate to adaptations
- Determine the tolerance limits of various organisms
- Influence of temperature on rainbowfish spawning
- Reproductive behaviour of aquarium fish
- Navigation of ants by pheromones (e.g. in trail-following)
- Effect of light and/or temperature on the behaviour of fish
- Direction-finding in pond snails. (In general snails are good animals to work on: they are easy to keep, move slowly and don't answer back!).
- Learning and colour/pattern recognition in relation to feeding behaviour of fishes.
- Energy budgets of insects of different ages
- Factors affecting the distribution patterns of different animal species, e.g. planarians, shrimps, barnacles, mussels.
Correlational Studies
The following are experimental student experiment suggestions which do not involve the "artificial" manipulation of variables, rather relying on natural variation. This type of investigation is known as a "correlational study" as you you look for correlations between variables rather than artifically manipulating them.
- Feeding preferences of dogs/cats/green ants.
- Compare and display various egg types from a range of organisms and discuss the various adaptations, survival and developmental, the types of eggs convey.
- Determine the concentration of bacteria in various situations, e.g. milk at different ages, water from local creek.
- Isolate pure cultures of microbes from soil, the Banyan, the pond or any other safe source. Check your chosen source with your teacher.
- Compare the eggs of various fishes and relate the egg's properties to the niche of the egg and the adaptations it has for survival.
- Compare the histology of various structures of invertebrates using the microtome…… prepare slides of various structures for various adaptations.
- Compare the reproductive organs of various fishes….. possibly even various stages of maturity.
- Analysis of territorial behaviour in birds, e.g. magpies. (Ideal for keen bird-watchers.)
- Analysis of web-building by spiders as an example of innate behaviour.
- Stalking behaviour in cats. (In general many interesting projects can be carried out on pets but be sure to adopt a rigorous scientific approach using artificial manipulation of variables or correlation of naturally occurring variables (concomitant variation).
- How does the shell of a snail grow in size and shape as a snail becomes larger?
Homeostasis is the condition where the body's internal environment remains relatively constant despite external fluctuations. It is the job of the body's organ systems to maintain it, even as they make necessary exchanges with the environment. Although many projects will be related to homeostasis in the human body, projects involving investigation of Stimulus-Response in invertebrates and in plants are also possible (see Behaviour Options below).
It may be worth reading the CAUTION below about using students as the subjects for experiments. There are several sensors that can be used to provide quantitative data. Diane Mackenzie at Clairvaux MacKillop focuses on homeostasis in Year 12 student experiments - using a number of sensors for measuring surface/skin temperature, ECG, heart rate, hand dynamometer for measuring force or strength, spirometer, respiration monitor belt. Students are taught to use LoggerPro software with some basic sensors in the Junior school.
How does human cognitive ability change with temperature change?
Humans can't think straight when they are cold. We all know that. But can this be quantified? If you gave a student some simple maths questions (15 + 8) and noted the score (out of 30) and then had the student climb into a wheelie bin of icy water for 5 minutes - would they be able to do as well on a similar test. I would think not. But, what process is operating here?
You'd need some good biological theory to justify your hypothesis before you even started. And are all students the same? Do students with a higher BMI respond with a smaller change in achievement (almost said "ability")? How do you measure a student's core temperature? Photos below courtesy of Moreton Bay Boys College.
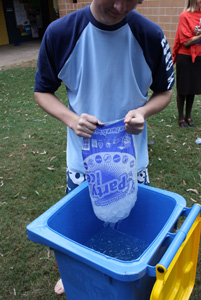
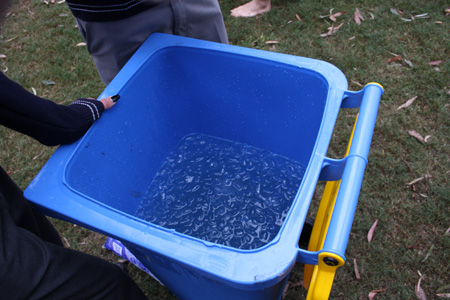
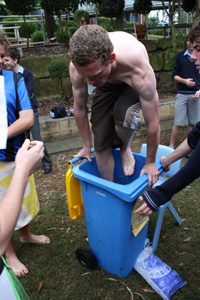
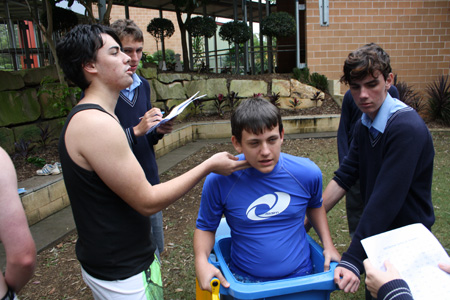
How do energy drinks affect heart rate and BP?
Here's a extract from a newspaper "Energy drinks may help you to exercise but they also raise heart rates and blood pressure, say researchers. They contain chemicals including caffeine and taurine, an amino acid, that stoke up alertness but are potentially harmful to those with heart conditions. A study in Detroit has found they can even harm consumers who are simply sitting still. Dr James Kalus, of the Henry Ford Hospital, said: "We saw increases in both blood pressure and heart rate in healthy volunteers who were watching movies. They were just in a resting state."
This suggests a good student experiment. You could compare water, uncaffeinated soft drink, energy drinks (eg Red Bull) and make an assessment of the effect on psychomotor performance (reaction time, concentration, memory) and physical endurance (aerobic endurance - time when maintaining 65–75% max. heart rate) and anaerobic performance (maintaining max. speed) on an exercise bike.
 |
 |
 |
| Water - the "control". | Or would ordinary sugary lemonade be the "control"? | Red Bull - a can of independent variable |
CAUTION
Teachers are greatly concerned about using human subjects in experiments. After all, students are animals but are not the "live, non-human vertebrates" that the Animal Care and Protection Act 2001 or the 2004 Code of Practice refers to. Nevertheless, the concerns for student welfare are paramount. This is why teachers are very cautious when it comes to students doing experiments on themselves or on fellow students. Anyone planning to do experiments involving students as subjects should be aware of the risks and protocols and not take anything written here as condoning or promoting the practice. Each jurisdiction will have its own rules and precautions.
A note from one Queensland Biology teacher (below) may give an idea of the concerns he had.
Every year our Year 9 students conduct an student experiment into the effects of exercise on their body. They come up with a method which involves the type of exercise and the method for data collection. They make a choice to collect data on body temperature, heart rate, breathing rate, skin temperature, sweating rate (this is a little subjective). This is great for the homeostasis unit.
I had a group of two students last year who tested energy drinks on their heart rate. Obviously this has some potential risks. To minimise these, I made them have a medical with their GP and then provide a medical certificate of this. They had to have a note from their parents approving the hypothesis, the method, and that they had read the outline of their introduction and the potential effects of the drinks on the body before they started. Also they could only have one energy drink in the day. (They assured me they have this every day anyway). They ended up splitting the drink into 5 parts and drinking these throughout the lesson while hooked up to the heart rate monitor. One of them also tested blood sugar. They were trained by their GP how to do this and had to demo their competence on how to test blood sugar to our school nurse before they could do it at school. We minimised risk by only one student being the one that tested so the equipment could not be mixed up and we had them dispose themselves too.
I had discussed the idea with our SOO (Scientific Operations Officer, ie the "Labbie") who is trained in WHS and we came up with the above plan to minimise the risks. Our SOO was either present or on call to provide sterile swabs and gloves etc where required and the student sterilised the bench after completion with ethanol. From memory it was not overly successful as they did not allow enough time between 'drinks' for the drink to take and effect the blood sugar - though I think the heart rate was a little better…. They made the assumption that the drink would start effecting blood sugar immediately which it did not. I see risk assessments are to eliminate risk so far is reasonably practicable or to minimise risk so far as is reasonably practicable. The 'reasonably practicable' to me means we need to consider the need for students to learn also (in a safe environment), as that is what school are designed for.
All of this that we did was way over the top I believe, but next time I would do the same…. I took the assumption that I could tell them not to do the topic for an student experiment, yet they may well do it at home. … If they did not do this at school where we can control the environment and manage the risks, they may well do them at home without consideration of risks… I know which one I would prefer. DT, 28 Nov 2012
ADDITIONAL COMMENT
Another Biology teacher said that "human subject" experimentation for an student experiment should be "actively discouraged". He said that the safety concerns were such that an student experiment should be ruled out anyway, but added:
"at no stage should we subject students in Senior Biology to any form of physiological testing of systems. Physical, by all means, as the data gathered can conceivably be thought of as representative. Data gathered physiologically cannot be accurate or robust enough over the course of a single term, with the necessary control of all variables, to deliver anything but superficial data."
How do caffeinated soft drinks affect heart rate and BP?
Here's a follow-up to the one above, but without using energy drinks such as Red Bull. Why not see how caffeinated drinks affect BP and heart rate. In this student experiment you might like to compare: water, uncaffeinated sugar-sweetened soft drink (eg uncaffeinated Coke), unsweetened caffeinated soft drink (Diet Coke or Coke Zero. Perhaps you could look at psychomotor performance and physical endurance as above. See note above on concerns when students are the subject of experiments.
 |
 |
 |
| Uncaffeinated Diet Coke - is the "control" or should water be the control? | Caffeine but no sugar. | Caffeine and sugar. |
The Effects of Exercise on the Maintenance of Homeostasis
Does an individual's ability to return to their normal physiological state, after a period of exercise, depend on individual differences?
Homeostasis is the maintenance of a relatively stable internal environment. However, exercise disrupts homeostasis. The changes that occur in response to exercise are the body's attempt to reduce the stress that has been placed on the entire organism. Changes that are normal during exercise would be considered abnormal if they were occurring in a non-exercising individual. For example, the level to which the body temperature rises during exercise would be considered a fever if the person were not exercising. Exercise physiology is the study of both the functional changes that occur in response to a single bout of exercise and the adaptations that occur as a result of regular, repeated bouts of exercise. Suggested student experiment - courtesy of St Aidan's College, Corinda.
SOME OTHERS
- Is reaction time altered following intense exercise? (need more than one type of exercise). How will reaction time be measured?
- Does reaction time differ according to the time of day?
- How initiating the respiratory system before exercise effects recovery. If athlete initiated respiratory system directly before commencing exercise then the athlete should have faster recovery rate because if muscle cells receive oxygen in advance, cells can aerobically respire during exercise, not anaerobically which forces lungs to respire heavily after exercise.
- The temperature of the earth is increasing due to global warming. Could an increase in temperature increase the body's food requirements?
-
Exercising causes the core body temperature to increase. If diffusion rates increase in response to temperature, should food be consumed directly after exercise?
What factors have the greatest impacts on reflexes and response time? What is the recipe for maximum response time? Teenagers are said to be most mentally active later in the day. Do reaction times during the day confirm this? Should school hours be altered? Are reaction times affected by food intake, rest, time of day or exercise? If so, should the school day be altered in some way to allow students to achieve maximum alertness.
- Hot Biceps. Why do my muscles get hot when I use them? How hot do weightlifters/cyclists muscles get? How long does it take for them to cool down?
- Muscle Fatigue. What causes muscle fatigue? How quickly do muscles recover ? How does training build strength?
- Cardiovascular fitness. Interval training versus weight training.
- Heart attack. What effect does exercise have on an ECG? What does the ECG of a heart attack victim look like?
- Breathe Deep. Yoga promotes well being and improves lung function - is it a good training technique? What other techniques are used?
- WII Fit. Can training improve reaction times - what other factors affect reaction times?
- Nerve pathways. Left brain, right brain dominant?
- Reflex Actions - Can individual differences be attributed to any physical differences.
-
To dance or to run? Which sports increase your fitness faster over a set period of time? Not today!!! Does regular exercise have a greater influence on fitness than sporadic exercise? Should school students be required to exercise everyday?
BEHAVIOUR OPTIONS
Conditioning mice to follow a stimulus to food
This suggestion is about the factors affecting the ability of mice to run a maze? From a student (Jessica, Yr 12) at Moreton Bay College:
"The question that triggered the topic for this investigation was, "If humans are believed to have a greater learning ability at a younger age, and if they share a similar genetic makeup to mice, do mice learn at younger ages too?" The aim of the investigation was to determine how the factor of age in mice affects their ability to learn how to navigate a maze. It was hypothesized that the younger mice would demonstrate the greatest learning ability, the adults would have a slightly decreased ability and the teenagers having the smallest learning ability".
Here's a little bit of Jessica's introduction:
"Each different species of animal learn differently according to their anatomy, physiology and psychology that evolves from environmental pressures over many years. Several factors affect an animal's learning ability. These include developmental factors - such as age, physiological state and psychological state - and the sensory abilities, as well as the emotional state of the animal at the time of learning.
"An animal's ability to learn greatly depends on its capacity to memorise. Mice, which have a remarkable genetic similarity to humans, refer to their episodic memory when learning how to navigate a maze. Episodic memory is the memory of events in our lives which, in the case of a mouse, would be the previous times they had run through the maze. The two learning types that exist for animals are able to be used by mice when navigating a maze: classical conditioning (learning by association) and operant conditioning (learning through a process of trial and error).
"Classical conditioning is used in maze navigation in that the mouse associates reaching the end of the maze with a reward - usually food or its home. But it does not achieve the same effect that classical conditioning usually achieves, which is to produce a response from a conditioned stimulus (i.e. in Pavlov's dogs, the bell stimulus producing salivation response in the dogs to replace the food stimulus).
"Operant conditioning is the major learning in action through the mouse having to trial different directional turns to see which combination leads it to the reward. As the mouse navigates the maze again and again, there are many physical changes that are occurring inside its brain that allow it to learn the correct route."
Note: very strict rules apply to the use of animals in schools in Queensland. Information can be found at the official link Animals in Education.
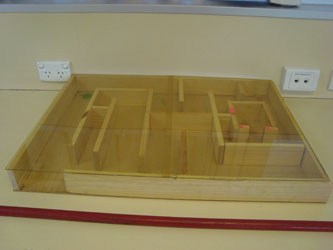 |
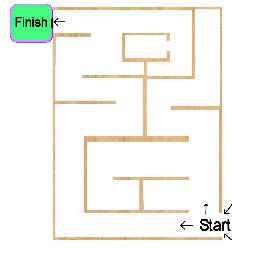 |
| Ebony, Jess and Anna's mouse maze |
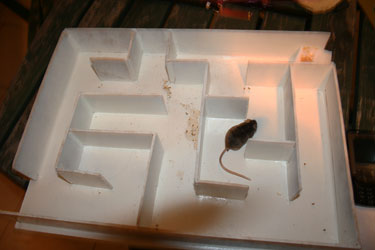 |
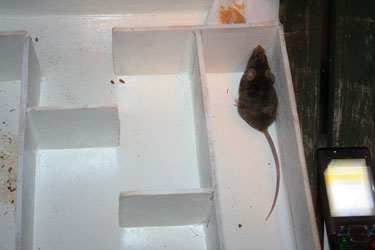 |
| "Tiny" is on the move. | "Tiny" smells the food but is in a dead-end. What to do? |
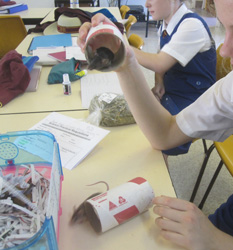 |
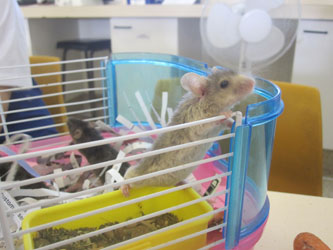 |
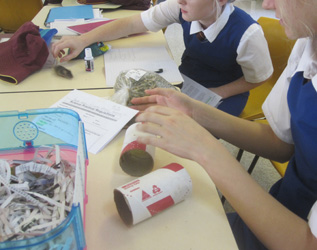 |
| Eyeing off each other. | Sniffing the air in the lab. | Strict animal experimentation rules apply. |
Sensation of smell and taste
It is often said that heavy smokers can't taste and smell things as well as non-smokers. Can you conduct experiments to show if this is so? Can you relate your findings to the length of time the people have been smoking and/or the number of cigarettes they have each day?
Easiest substances to use are ones that you can measure and dilute accurately so you can find out what is the lowest concentration of a substance your tester can smell or taste (a few suggestions - vinegar, honey, sesame seed oil, chilli sauce etc - don't use anything poisonous or substances that will evaporate very fast). Many of the things we think we taste, we really smell, and there are only four basic taste sensations, sweet, acid, salty and bitter. Click Project 12-1 for Prof. Jennifer McComb's resource sheet.
Schooling behaviour of fish
Many small fish show a tendency to school but it is not always clear whether they are responding to each other or to a common external factor. You can test some of the factors that influence schooling using an aquarium. Although this sort of work has mainly been done using freshwater "tropical" fish, it is equally feasible to use coldwater, estuarine or marine fish - as long as they are small enough. Click Project 9-2 for Prof. Jennifer McComb's resource sheet. If you plan to undertake an student experiment such as this you should be aware of legislation regarding the use of animals in education.
Landing sites of flies
Flies seem to land more thickly on some people's backs than others. Do they smell nicer (to the flies!) or is it maybe because they are wearing clothes of a certain colour? If the smell is attractive enough will the flies worry about colours? To standardize your experiment you will need some cooperative friends to have a swim then to sunbake and work up a nice sweat. To compare between people simply count numbers of flies in a marked area on their backs at set times. How will you make sure all the bits of cloth smell the same at the beginning of the experiment? Click Project 7-6 for Prof. Jennifer McComb's resource sheet.
- Relationships between green ants and other organisms
- Defensive behaviours of green ants
- Innate behaviour of insects to fly, walk etc
- Hearing of cockroaches
- Feeding behaviour of different species of fish
- Attack behaviour of fish to prey
- Different feeding patterns of fish feeding on different food types, still, moving etc
- Conditioning of barra to luring (fishing with lures)
- Conditioning barra to feed
- Conditioning mice to follow a stimulus to food….factors affecting ability to run a maze
- Conditioning chickens
- Chicken behaviour observations
- Conditioning sensitive weed and venus flytraps
- Effect of different coloured stimuli on barra feeding
- Design the most effective lure for catching barra
- Native Seed germination - heat or hormones - which is more effective?
- Behaviour of Woodlice - investigate turn alternation using a maze.
- Osmoregulation in crabs - set up a marine aquarium and investigate changes in salinity
- Cricket chirping - what affects the rate of chirping in crickets?
- Diurnal rhythms. What are they? Do they really exist in humans? Why? (Possible ERT stimulus).
ACKNOWLEDGEMENTS
Some of the student experiment ideas that follow have been suggested by the Senior Biology teachers at Tully SHS and Innisfail State College, Queensland, Australia. My thanks to Darrin Timms, HoD Land and Sea Science, Innisfail State College, 45 Flying Fish Point Road, Innisfail Qld 4860 Australia. I have been given access to the work of students at Moreton Bay College and would like to thank Biology teacher Josie O'Shea for her assistance. My thanks also to the Biology teachers from Nanango SHS and to Diane Mackenzie (Clairvaux MacKillop College), Sylvia Hicks (St Aidan's College), Shan Wainwright (Mt Maria College), Steve Mead (Browns Plains SHS), Charmaine Keal (Tullawong SHS) and John Andrews (HOD Science, Matthew Flinders Anglican College) for providing their student experiment tasks and suggestions.
I'd also like to thank Professor Jennifer McComb, School of Environmental and Life Sciences, Murdoch University, Western Australia for her encouragement and permission to use suggestions from her "Biology Projects for High School Students". Note: any of the tasks and comments on this page are not necessarily endorsed by the Queensland Curriculum and Assessment Authority or the schools mentioned. This work is about teachers sharing their own resources.
USE OF ANIMALS IN SCHOOL INVESTIGATIONS
Many of the suggestions below involve the use of animals.
Various laws apply to the use of animals in schools particularly any "live non-human vertebrate, that is fish, amphibians, reptiles, birds and mammals, encompassing domestic animals, purpose-bred animals, livestock, wildlife, and also cephalopods such as octopus and squid".
Teachers should consult the Animal Care and Protection Act 2001, and The Australian code of practice for the care and use of animals for scientific purposes (2004)and be aware of the many laws and requirements governing the use of animals in schools, even for observation. You should be aware that you must submit applications to the Queensland Schools Animal Ethics Committee (QSAEC) and have those applications approved before any animal-use activities can be undertaken in your school. Non-State schools in Queensland must apply for Queensland Department of Primary Industries & Fisheries (QDPI&F) registration prior to sending an application.
Be prepared for a long wait if you haven't done this before: Moreton Bay College took 2 years to get approval for their mice and chicken behavioural experiments (see below). A good starting point for more information for Queensland teachers is the Animals in Education website. Click here for an extract from the Biology syllabus regarding animal experimentation. Different precautions are necessary when students themselves are the subjects of experimentation (eg in homeostasis experiments). There is a CAUTION in the homeostasis section later on about this.
Risk Assessment Teachers in non-government schools may find the Queensland Department of Education and Training's Curriculum Activity Risk Management Guidelines (CARA) useful.